Salaries in Chicopee, MA

Updated on Apr 14, 2025
City
Salary

What is the average salary in Chicopee, MA?

The average salary in Chicopee, MA is $55,133 per year.

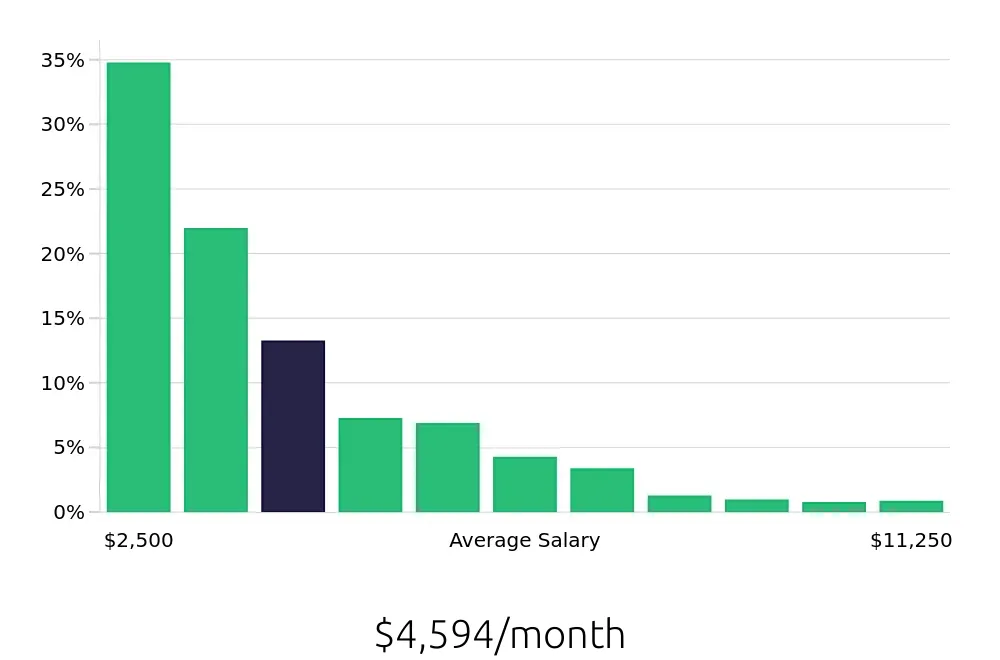
Chicopee, MA, offers a range of salary opportunities across various sectors. The average yearly salary in the area stands at $55,133, reflecting a competitive job market. The salary distribution shows that the majority of positions fall between $30,000 and $87,273 annually. Notably, the highest concentration of jobs, at 34.7%, is in the $39,545 to $49,091 range. This distribution indicates a balanced mix of entry-level and mid-level positions, providing ample opportunities for career growth. Job seekers in Chicopee can expect a variety of roles that cater to different skill levels and professional aspirations.

View Jobs in Chicopee, MA

What are the best paying jobs in Chicopee, MA?

Chicopee, MA offers a range of high-paying job opportunities across various sectors. Leading the list are Behavior Analysts, with an average salary of $90,761, followed closely by Registered Nurses at $90,402. Other well-compensated roles include Speech Language Pathologists, Licensed Practical Nurses, and Instructors, all offering competitive salaries. These positions reflect Chicopee's commitment to rewarding skilled professionals in critical fields.
Graph displaying best paying job salaries in Chicopee, MA, highlighting Behavior Analyst with the highest at $90,761 and Substitute Teacher with the lowest at $49,068.
  1. Behavior Analyst
    Average Salary: $90,761
    This role involves working with individuals to improve their behavior, often in educational or clinical settings. Companies like ABC Behavior Services and Chicopee Public Schools are hiring for this role.
    Find Behavior Analyst jobs in Chicopee, MA


  2. Registered Nurse
    Average Salary: $90,402
    RNs provide and coordinate patient care, educate patients about health conditions, and offer emotional support. Baystate Medical Center and Cooley Dickinson Hospital are prominent employers in this field.
    Find Registered Nurse jobs in Chicopee, MA


  3. Speech Language Pathologist
    Average Salary: $87,163
    SLPs work with patients to improve their communication skills. They often collaborate with schools and healthcare providers. Chicopee Medical Center and local schools are hiring for this role.
    Find Speech Language Pathologist jobs in Chicopee, MA


  4. Licensed Practical Nurse
    Average Salary: $78,783
    LPNs provide basic patient care under the supervision of RNs and doctors. They work in hospitals, clinics, and long-term care facilities. Baystate Medical Center and local nursing homes are hiring.
    Find Licensed Practical Nurse jobs in Chicopee, MA


  5. Instructor
    Average Salary: $66,135
    Instructors teach various subjects, often in educational institutions. They prepare lesson plans and assess student progress. Local colleges and vocational schools are hiring for this role.
    Find Instructor jobs in Chicopee, MA


  6. Clinician
    Average Salary: $65,168
    Clinicians provide mental health services, often in private practices or clinics. They conduct assessments and develop treatment plans. Companies like ABC Counseling and local clinics are hiring.
    Find Clinician jobs in Chicopee, MA


  7. General Manager
    Average Salary: $59,021
    General managers oversee the operations of businesses, ensuring efficiency and profitability. They manage staff and handle customer relations. Local restaurants and retail stores are hiring.
    Find General Manager jobs in Chicopee, MA


  8. Dental Assistant
    Average Salary: $53,531
    Dental assistants support dentists during procedures, prepare patients, and maintain equipment. They work in dental offices and clinics. Local dental practices are hiring.
    Find Dental Assistant jobs in Chicopee, MA


  9. Automotive Technician
    Average Salary: $52,491
    Technicians diagnose and repair vehicles, perform maintenance, and advise customers. They work in auto repair shops. Local auto repair shops are hiring.
    Find Automotive Technician jobs in Chicopee, MA


  10. Substitute Teacher
    Average Salary: $49,068
    Substitute teachers provide instruction in the absence of regular teachers. They follow lesson plans and maintain classroom order. Local school districts are hiring.
    Find Substitute Teacher jobs in Chicopee, MA

What are the best paying jobs in Chicopee, MA without a degree?

In Chicopee, MA, several high-paying jobs do not require a degree, offering competitive salaries and valuable career opportunities. Roles such as Restaurant Manager, Server, and Landscaper provide substantial earnings, with average salaries ranging from $30,000 to nearly $50,000 annually. These positions cater to diverse skill sets and can serve as stepping stones for professional growth.
Graph displaying best paying job salaries in Chicopee, MA without a degree, highlighting Restaurant Manager with the highest at $49,285 and To Go Specialist with the lowest at $30,000.
  1. Restaurant Manager
    Average Salary: $49,285
    Manage daily operations, oversee staff, and ensure customer satisfaction. Work in local establishments like The Bistro and The Olde Corner Pub. Gain experience in a vibrant dining environment.
    Find Restaurant Manager jobs in Chicopee, MA


  2. Server
    Average Salary: $43,718
    Serve food and beverages to customers, take orders, and ensure a pleasant dining experience. Opportunities exist in popular spots like The Olde Corner Pub and The Bistro. Develop strong customer service skills.
    Find Server jobs in Chicopee, MA


  3. Landscaper
    Average Salary: $40,357
    Maintain and beautify outdoor spaces, including lawns, gardens, and parks. Work with local businesses and homeowners. Gain hands-on experience in horticulture and landscaping.
    Find Landscaper jobs in Chicopee, MA


  4. Housekeeping
    Average Salary: $38,079
    Clean and maintain rooms in hotels, motels, and other accommodations. Work in local establishments like the Comfort Inn and the Holiday Inn Express. Develop attention to detail and organizational skills.
    Find Housekeeping jobs in Chicopee, MA


  5. Line Cook
    Average Salary: $37,529
    Prepare ingredients and cook food in a fast-paced kitchen environment. Work in local restaurants like The Bistro and The Olde Corner Pub. Gain experience in food preparation and kitchen operations.
    Find Line Cook jobs in Chicopee, MA


  6. Dishwasher
    Average Salary: $36,239
    Clean dishes, utensils, and kitchen equipment. Work in local restaurants like The Bistro and The Olde Corner Pub. Develop strong work ethic and attention to detail.
    Find Dishwasher jobs in Chicopee, MA


  7. Floor Manager
    Average Salary: $34,918
    Supervise and coordinate activities on the sales floor. Work in local retail stores like Target and Walmart. Develop leadership and customer service skills.
    Find Floor Manager jobs in Chicopee, MA


  8. Kitchen Team Member
    Average Salary: $33,328
    Assist in food preparation, cooking, and kitchen maintenance. Work in local restaurants like The Bistro and The Olde Corner Pub. Gain experience in kitchen operations and food service.
    Find Kitchen Team Member jobs in Chicopee, MA


  9. Sewing Machine Operator
    Average Salary: $30,521
    Operate sewing machines to produce garments and textiles. Work in local manufacturing companies like Chicopee Manufacturing Company. Gain experience in garment production and textile manufacturing.
    Find Sewing Machine Operator jobs in Chicopee, MA


  10. To Go Specialist
    Average Salary: $30,000
    Prepare and package food for takeout orders. Work in local restaurants like The Bistro and The Olde Corner Pub. Develop skills in food preparation and customer service.
    Find To Go Specialist jobs in Chicopee, MA

Which companies offer the top salaries in Chicopee, MA?

In Chicopee, MA, May Institute leads the way with the highest average salary at $59,521. Following closely, Chicopee Public Schools offers an average salary of $58,535. These figures highlight the competitive compensation packages available in the area.
Graph displaying company salaries in Chicopee, MA, highlighting May Institute with the highest at $59,521 and Domino's with the lowest at $39,136.
  1. May Institute
    Average Salary: $59,521
    May Institute provides behavioral health and education services for children and adults with autism and other developmental disabilities.


  2. Chicopee Public Schools
    Average Salary: $58,535
    Chicopee Public Schools is a school district that offers educational programs for students from kindergarten through high school.


  3. Center for Human Development
    Average Salary: $54,317
    Center for Human Development offers services to individuals with intellectual and developmental disabilities, helping them achieve their full potential.


  4. CVS Health
    Average Salary: $52,233
    CVS Health is a healthcare company that provides pharmacy services, health insurance, and other healthcare-related products and services.


  5. PriceRite Marketplace
    Average Salary: $45,894
    PriceRite Marketplace is a discount department store that offers a variety of products, including groceries, clothing, and household items.


  6. Ninety Nine Restaurant & Pub
    Average Salary: $45,115
    Ninety Nine Restaurant & Pub is a casual dining restaurant that offers a variety of American dishes and a casual atmosphere.


  7. CITY OF CHICOPEE
    Average Salary: $42,531
    The City of Chicopee is a local government that provides various services to its residents, including public safety, transportation, and public works.


  8. Jpolep Distribution
    Average Salary: $42,243
    Jpolep Distribution is a wholesale distributor of food and beverage products, serving restaurants, hotels, and other foodservice establishments.


  9. ServiceNet
    Average Salary: $39,380
    ServiceNet is a non-profit organization that provides services to individuals with disabilities, helping them achieve independence and improve their quality of life.


  10. Domino's
    Average Salary: $39,136
    Domino's is a pizza delivery and carryout chain that offers a variety of pizza options, as well as other menu items like pasta and salads.

How does the cost of living in Chicopee, MA compare to the national average?

The cost of living index in Chicopee, MA, stands at 98, which is slightly below the nationwide average of 100. Housing costs are 14% higher, while miscellaneous expenses are 10% lower than the national average.
Cost of living comparison graph for Chicopee, MA vs. Nationwide: housing 14% higher, groceries 3% lower, utilities 3% higher, transportation 5% lower, healthcare 0% lower, miscellaneous 10% lower.

When considering a move to Chicopee, Massachusetts, job seekers will find the cost of living index offers a balanced perspective compared to the nationwide average, which is set at 100. Chicopee's housing index stands at 114, indicating that housing costs are 14% higher than the national average. This increase might be a significant factor for those evaluating relocation, as housing often represents a substantial portion of monthly expenses.


Other aspects of living in Chicopee, such as groceries and utilities, align closely with the national average. Groceries have an index of 97, which is 3% lower than the average, potentially offering some savings in this area. Utilities, on the other hand, are slightly above average at 103, representing a modest 3% increase. Transportation costs in Chicopee are 5% below the national average, with an index of 95, which could be a relief for those who rely on personal vehicles. Healthcare costs remain consistent with the national average, providing stability in this critical area. Miscellaneous expenses, however, are 10% lower than the average, with an index of 90, offering additional savings in everyday spending. Overall, Chicopee presents a cost of living that is slightly higher in some areas but offers savings in others, making it a viable option for many job seekers.

Compare Salaries

What are other cities like?
Compare different cities.
Select a city
Thank you! Your submission has been received!
Oops! Something went wrong while submitting the form.
a hand paying employees
Pasadena, TX
Pasadena, TX, boasts a cost of living index that is 94.4% of the nationwide average, making it a relatively affordable place to live. This index reflects a balanced distribution across various categories, including housing, groceries, and utilities, offering a cost-effective living option for professionals.
Learn more
Pearland, TX
Pearland, TX, presents a cost of living index that is 98% of the nationwide average, indicating a slightly lower cost of living. This makes it an attractive option for those seeking a balance between affordability and quality of life.
Learn more
Pembroke Pines, FL
Pembroke Pines, FL, exhibits a cost of living index that is 10% higher than the nationwide average, primarily driven by elevated housing costs. Other categories like groceries and transportation also slightly exceed the national average, while utilities and healthcare remain close to it.
Learn more
Pflugerville, TX
Pflugerville, TX, presents a cost of living index that is 95% of the nationwide average, indicating a slightly lower overall cost of living. This makes it an attractive option for those seeking a balance between affordability and quality of life.
Learn more
Pinellas Park, FL
Pinellas Park, FL, boasts a cost of living index that is 97% of the nationwide average, reflecting a slightly lower overall cost of living. Notably, the housing and utilities sectors contribute to this favorable comparison, with indices of 95% and 96%, respectively.
Learn more
Plano, TX
Plano, TX, exhibits a cost of living index of 105, which is 5% higher than the nationwide average of 100. This suggests that overall expenses in Plano are slightly above the national standard.
Learn more
Plantation, FL
Plantation, FL, exhibits a cost of living index that is 12% higher than the nationwide average, primarily driven by elevated housing costs. Other categories like groceries and transportation also slightly exceed the national average, while utilities and healthcare remain relatively close to it.
Learn more
Pomona, CA
Pomona, CA, exhibits a cost of living index that is 52% higher than the nationwide average, primarily driven by elevated housing costs. Other categories like groceries and utilities also show slight increases, while healthcare costs remain below the national average.
Learn more
Pompano Beach, FL
Pompano Beach, FL, exhibits a cost of living index that is 10% higher than the nationwide average, primarily driven by elevated housing costs. Other categories like groceries and transportation also surpass the national average, while utilities and healthcare remain slightly below.
Learn more
Puyallup, WA
Puyallup, WA, exhibits a cost of living index that is 10% higher than the nationwide average, primarily driven by elevated housing costs. Other categories like groceries and miscellaneous expenses also surpass the national average, while utilities and transportation remain relatively close to the benchmark.
Learn more
Quincy, MA
Quincy, MA, exhibits a higher cost of living compared to the nationwide average, with an overall index of 125%. This indicates that residents can expect to spend 25% more across various living expenses.
Learn more
Rancho Cordova, CA
The cost of living index in Rancho Cordova, CA, stands at 115%, surpassing the nationwide average by 15%. This indicates that living expenses in Rancho Cordova are generally higher than the national average.
Learn more
Redmond, WA
Redmond, WA, exhibits a cost of living index that is 45% higher than the nationwide average, primarily driven by elevated housing costs. Other categories such as groceries and miscellaneous expenses also surpass the national average, though to a lesser extent.
Learn more
Renton, WA
The cost of living index in Renton, WA, stands at 120, which is 20% higher than the nationwide average of 100. This elevated index reflects higher expenses in various sectors, including housing and healthcare.
Learn more
Richardson, TX
The cost of living index in Richardson, TX, stands at 105, which is 5% higher than the nationwide average of 100. This indicates that overall expenses in Richardson are slightly above the national average.
Learn more
Riverside, CA
Riverside, CA, exhibits a cost of living index that is 23% higher than the nationwide average, primarily driven by elevated housing costs. This makes Riverside a noteworthy location for job seekers considering the overall living expenses.
Learn more
Roseville, CA
Roseville, CA, exhibits a higher cost of living compared to the nationwide average, with a cost of living index of 128. This indicates that living expenses in Roseville are 28% above the national average.
Learn more
Round Rock, TX
The cost of living index in Round Rock, TX, stands at 101, slightly above the nationwide average of 100. Housing, groceries, and healthcare costs are notably higher, while utilities and transportation costs are relatively lower.
Learn more
Sacramento, CA
Sacramento, CA, exhibits a cost of living index that is 10% higher than the nationwide average, primarily driven by elevated housing costs. Despite this, other categories like groceries and utilities remain relatively close to the national average.
Learn more
Sammamish, WA
Sammamish, WA, exhibits a cost of living index that is 72% higher than the nationwide average, primarily driven by a 72% increase in housing costs. Other categories like groceries and utilities also show above-average expenses, making it a significant consideration for job seekers.
Learn more
San Antonio, TX
San Antonio, TX, boasts a cost of living index that is 92% of the nationwide average, making it a more affordable option for many professional job seekers. This index reflects lower housing costs and competitive prices across other essential categories.
Learn more
San Diego, CA
San Diego, CA, exhibits a cost of living index that is 46% higher than the nationwide average, primarily driven by elevated housing costs. Other categories like groceries and transportation also surpass the national average, contributing to the overall higher living expenses.
Learn more
San Jose, CA
San Jose, CA, exhibits a higher cost of living compared to the nationwide average, with an overall index of 139.8. This represents a 39.8% increase over the national average of 100.
Learn more
San Marcos, CA
San Marcos, CA, exhibits a higher cost of living compared to the nationwide average, with an overall index of 118. Housing costs notably stand at 62% above the national average, making it a significant factor in the city's elevated cost of living.
Learn more
San Marcos, TX
San Marcos, TX, boasts a cost of living index that is 94% of the nationwide average, reflecting a generally affordable living environment. This index, derived from housing, groceries, utilities, transportation, healthcare, and miscellaneous expenses, positions San Marcos as a competitive choice for cost-conscious professionals.
Learn more
Sanford, FL
Sanford, FL, boasts a cost of living index that is 95% of the nationwide average, indicating a slightly lower cost of living in this area. This makes Sanford an attractive option for those seeking a more affordable lifestyle without compromising on quality.
Learn more
Santa Clara, CA
Santa Clara, CA, boasts a cost of living index that is 189.9% of the nationwide average, reflecting significantly higher expenses, particularly in housing. This elevated index underscores the importance of considering these costs when planning a move to the area.
Learn more
Santa Clarita, CA
Santa Clarita, CA, exhibits a higher cost of living compared to the nationwide average, with an overall index of 116. This indicates that living expenses in Santa Clarita are 16% above the national average.
Learn more
Schertz, TX
Schertz, TX, boasts a cost of living index that is 96% of the nationwide average, making it a slightly more affordable option for professional job seekers. Notably, housing costs in Schertz are 5% below the national average, offering a potential advantage for those relocating.
Learn more
Seattle, WA
Seattle, WA, exhibits a higher cost of living compared to the nationwide average, with an overall index of 128. This indicates that living expenses in Seattle are approximately 28% greater than the national average.
Learn more
Shoreline, WA
Shoreline, WA, exhibits a cost of living index that is 165% of the nationwide average in housing, reflecting a significant premium. Other categories like groceries and transportation also surpass the average, with indices at 110% and 120%, respectively.
Learn more
Somerville, MA
Somerville, MA, exhibits a cost of living index that is 17.3% higher than the nationwide average, primarily driven by elevated housing costs. Other categories like groceries and utilities remain close to the national average, making Somerville a competitive option for those prioritizing specific living expenses.
Learn more
Spokane Valley, WA
Spokane Valley, WA, presents a cost of living index of 98, which is slightly below the nationwide average of 100. This indicates that living expenses in Spokane Valley are generally 2% lower than the national average.
Learn more
Spokane, WA
Spokane, WA, presents a cost of living index that is 90% of the nationwide average, indicating a relatively affordable living environment for job seekers. This index reflects lower costs in housing and miscellaneous expenses, making it an attractive option for those seeking a balanced lifestyle.
Learn more
Springfield, MA
Springfield, MA, boasts a cost of living index that is 91% of the nationwide average, indicating a relatively affordable living environment for professional job seekers. Notably, housing costs are 22% below the national average, making it an attractive option for those seeking budget-friendly housing.
Learn more
Sugar Land, TX
The cost of living index in Sugar Land, TX, stands at 99, slightly below the nationwide average of 100. This indicates that living expenses in Sugar Land are nearly on par with the national average.
Learn more
Sunnyvale, CA
Sunnyvale, CA, exhibits a significantly higher cost of living compared to the nationwide average, with an overall index of 165. This represents a 65% increase over the national benchmark of 100.
Learn more
Tacoma, WA
Tacoma, WA, exhibits a higher cost of living compared to the nationwide average, with an overall index of 110. This indicates that living expenses in Tacoma are 10% above the national average.
Learn more
Tallahassee, FL
The cost of living index in Tallahassee, FL, stands at 91, which is 1% below the nationwide average of 100. This slight decrease suggests that living expenses in Tallahassee are marginally more affordable than the average American city.
Learn more
Tampa, FL
Tampa, FL, boasts a cost of living index that is 96% of the nationwide average, making it a relatively affordable place to live. Housing, groceries, and miscellaneous costs are slightly below the national average, while transportation costs are slightly above.
Learn more
The Colony, TX
The Colony, TX, boasts a cost of living index of 95, which is 5% lower than the nationwide average of 100. This makes it an attractive option for those seeking a more affordable living environment.
Learn more
The Woodlands, TX
The Woodlands, TX, exhibits a cost of living index that is 10% higher than the nationwide average, primarily driven by housing costs. Other categories like groceries and transportation remain slightly below the national average.
Learn more
Torrance, CA
The cost of living index in Torrance, CA, stands at 138, surpassing the nationwide average of 100. This indicates that living expenses in Torrance are 38% higher than the national average.
Learn more
Tukwila, WA
Tukwila, WA, exhibits a cost of living index that is 34% higher than the nationwide average in housing, while other categories like groceries and healthcare remain relatively close to the national average, making it a balanced consideration for job seekers.
Learn more
Vancouver, WA
Vancouver, WA's cost of living index stands at 98, slightly below the nationwide average of 100. This indicates that living expenses in Vancouver are generally 2% less than the national average.
Learn more
Vista, CA
The cost of living index in Vista, CA, stands at 124, which is 24% higher than the nationwide average of 100. This elevated index reflects higher expenses, particularly in housing, which is 79% above the national average.
Learn more
Westfield, MA
Westfield, MA, presents a cost of living index that is 98% of the nationwide average, indicating a slightly lower overall cost of living. Housing and miscellaneous expenses are notably lower, while utilities and healthcare costs are marginally higher.
Learn more
Weston, FL
Weston, FL, exhibits a cost of living index that is 15% higher than the nationwide average, primarily driven by elevated housing costs. Other categories like groceries and transportation also show modest increases, while utilities and healthcare remain close to the national average.
Learn more
Worcester, MA
Worcester, MA, presents a cost of living index that is 99% of the nationwide average, indicating a slightly lower cost of living in most areas. Notably, housing and utilities are below the national average, while groceries and transportation exceed it.
Learn more

There are 406 job openings in Chicopee, MA, today!

Take a deeper dive into the job market in Chicopee, MA

Discover what it's like to work in Chicopee, MA. Learn if you need a car, explore popular employers, the job market, and the best neighborhoods to live in.

City
Overview
Chicopee, MA
406 job openings