Salaries in El Cajon, CA

Updated on Apr 14, 2025
City
Salary

What is the average salary in El Cajon, CA?

The average salary in El Cajon, CA is $61,173 per year.

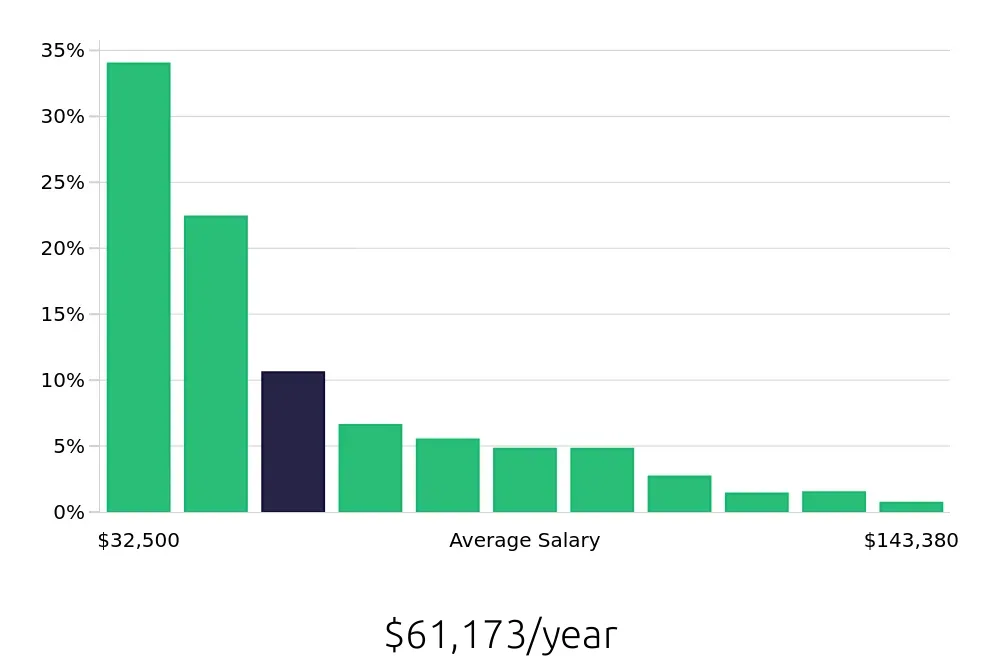
El Cajon, CA, offers a competitive salary landscape for job seekers. With an average yearly salary of $61,173, the city provides a range of opportunities across various sectors. The salary distribution shows that 34% of the workforce earns around $32,500 annually, while the top 1% enjoys salaries upwards of $133,300. This diverse salary range reflects the city's robust economy and the variety of industries present. For those seeking a balance between cost of living and income, El Cajon presents a favorable environment with numerous opportunities to advance and grow professionally.

View Jobs in El Cajon, CA

What are the best paying jobs in El Cajon, CA?

El Cajon, CA, offers a range of high-paying job opportunities across various sectors. Leading the list are Dental Hygienists, with an average salary of $111,707, followed by Technical Project Leads at $106,855. Other top-paying roles include Speech Language Pathologists, School Psychologists, and Occupational Therapists, all offering competitive compensation packages. These positions reflect the diverse and lucrative job market available in El Cajon.
Graph displaying best paying job salaries in El Cajon, CA, highlighting Dental Hygienist with the highest at $111,707 and Licensed Vocational Nurse with the lowest at $75,377.
  1. Dental Hygienist
    Average Salary: $111,707
    Dental hygienists clean teeth and examine patients for signs of oral diseases. They work in dental offices and clinics, such as those operated by Sharp HealthCare.
    Find Dental Hygienist jobs in El Cajon, CA


  2. Technical Project Lead
    Average Salary: $106,855
    Technical project leads manage and oversee technical projects. They coordinate with teams and ensure projects meet deadlines. Companies like Qualcomm often seek such professionals.
    Find Technical Project Lead jobs in El Cajon, CA


  3. Speech Language Pathologist
    Average Salary: $103,984
    Speech language pathologists assess and treat speech and language disorders. They work in healthcare facilities and schools, collaborating with patients to improve their communication skills.
    Find Speech Language Pathologist jobs in El Cajon, CA


  4. School Psychologist
    Average Salary: $100,457
    School psychologists support students' emotional and academic growth. They work in schools, providing counseling and developing intervention strategies. Local districts often hire these professionals.
    Find School Psychologist jobs in El Cajon, CA


  5. Occupational Therapist
    Average Salary: $100,213
    Occupational therapists help patients develop, recover, and improve daily living and work skills. They work in rehabilitation centers and hospitals, such as those run by Kaiser Permanente.
    Find Occupational Therapist jobs in El Cajon, CA


  6. Registered Nurse
    Average Salary: $99,480
    Registered nurses provide and coordinate patient care. They work in hospitals and clinics, ensuring patients receive proper medical attention. Sharp HealthCare is a notable employer in this field.
    Find Registered Nurse jobs in El Cajon, CA


  7. Charge Nurse
    Average Salary: $92,370
    Charge nurses oversee nursing staff and patient care in a shift. They ensure smooth operations in healthcare settings, often working in hospitals like Sharp Grossmont Hospital.
    Find Charge Nurse jobs in El Cajon, CA


  8. Commercial Service Technician
    Average Salary: $88,218
    Commercial service technicians install, maintain, and repair HVAC systems. They work for companies like Carrier, ensuring businesses have efficient heating and cooling systems.
    Find Commercial Service Technician jobs in El Cajon, CA


  9. Human Resources Manager
    Average Salary: $83,006
    Human resources managers oversee hiring, training, and employee relations. They work in various industries, ensuring companies maintain a productive workforce.
    Find Human Resources Manager jobs in El Cajon, CA


  10. Licensed Vocational Nurse
    Average Salary: $75,377
    Licensed vocational nurses provide basic patient care and support registered nurses. They work in hospitals and clinics, ensuring patients receive proper medical attention.
    Find Licensed Vocational Nurse jobs in El Cajon, CA

What are the best paying jobs in El Cajon, CA without a degree?

In El Cajon, CA, several high-paying roles do not require a degree. Restaurant managers lead teams and oversee operations, earning an average of $46,244 annually. Other well-compensated positions include housekeeping staff, earning around $41,263 per year, and baristas, with an average salary of $40,445.
Graph displaying best paying job salaries in El Cajon, CA without a degree, highlighting Restaurant Manager with the highest at $46,244 and Dishwasher with the lowest at $33,188.
  1. Restaurant Manager
    Average Salary: $46,244
    Manage daily operations, oversee staff, and ensure customer satisfaction. Work in various dining establishments, from casual cafes to fine dining restaurants. Companies like The Cheesecake Factory and Panera Bread offer opportunities.
    Find Restaurant Manager jobs in El Cajon, CA


  2. Housekeeping
    Average Salary: $41,263
    Maintain cleanliness and order in hotels, motels, and other lodging facilities. Perform tasks such as cleaning rooms, changing linens, and restocking supplies. Marriott and Hilton are prominent employers in the area.
    Find Housekeeping jobs in El Cajon, CA


  3. Barista
    Average Salary: $40,445
    Prepare and serve coffee and other beverages in cafes and restaurants. Interact with customers and take orders. Local coffee shops like Peet's Coffee and Starbucks provide employment opportunities.
    Find Barista jobs in El Cajon, CA


  4. Line Cook
    Average Salary: $39,424
    Prepare ingredients and cook food in commercial kitchens. Work in fast-paced environments and follow recipes. Restaurants like In-N-Out Burger and Chipotle offer positions.
    Find Line Cook jobs in El Cajon, CA


  5. Kitchen Team Member
    Average Salary: $38,173
    Assist with food preparation, cooking, and cleanup in a kitchen setting. Support chefs and cooks in various tasks. Opportunities exist in restaurants like Denny's and IHOP.
    Find Kitchen Team Member jobs in El Cajon, CA


  6. Server Assistant
    Average Salary: $37,538
    Support servers by setting up tables, taking orders, and clearing dishes. Work in a fast-paced environment and provide excellent customer service. Restaurants like Applebee's and Red Lobster offer positions.
    Find Server Assistant jobs in El Cajon, CA


  7. Server
    Average Salary: $34,161
    Take orders, serve food and beverages, and provide excellent customer service. Work in a fast-paced environment and ensure a positive dining experience. Restaurants like Olive Garden and TGI Fridays offer positions.
    Find Server jobs in El Cajon, CA


  8. Dishwasher
    Average Salary: $33,188
    Clean dishes, utensils, and kitchen equipment. Work in a fast-paced environment and ensure a clean and organized kitchen. Restaurants like McDonald's and Subway offer positions.
    Find Dishwasher jobs in El Cajon, CA

Which companies offer the top salaries in El Cajon, CA?

In El Cajon, CA, ProCare Therapy stands out as the highest-paying company with an average salary of $98,989. Other top employers like San Ysidro Health and St Paul's Senior Services also offer competitive compensation packages.
Graph displaying company salaries in El Cajon, CA, highlighting ProCare Therapy with the highest at $98,989 and Grossmont/Cuyamaca Community College District with the lowest at $68,524.
  1. ProCare Therapy
    Average Salary: $98,989
    ProCare Therapy is a leading provider of rehabilitation services, offering physical, occupational, and speech therapy. They are known for their commitment to patient care and professional development.


  2. San Ysidro Health
    Average Salary: $81,284
    San Ysidro Health is a non-profit community health center dedicated to providing quality healthcare services to underserved communities. They focus on comprehensive health care, including medical, dental, and behavioral health services.


  3. St Paul's Senior Services
    Average Salary: $78,031
    St Paul's Senior Services offers a range of residential and community-based care options for seniors. They emphasize dignity, respect, and quality of life for their residents.


  4. RSA Engineered Products, LLC
    Average Salary: $76,624
    RSA Engineered Products, LLC specializes in the development and manufacturing of advanced materials and components for various industries. They are recognized for their innovation and quality.


  5. Community Research Foundation
    Average Salary: $74,614
    Community Research Foundation is a non-profit organization dedicated to improving the health and well-being of communities through research and education. They focus on public health initiatives and community engagement.


  6. Anderson Plumbing Heating & Air
    Average Salary: $74,129
    Anderson Plumbing Heating & Air provides residential and commercial plumbing, heating, and air conditioning services. They are known for their reliability and customer service.


  7. Family Health Centers of San Diego
    Average Salary: $70,814
    Family Health Centers of San Diego is a community health organization offering comprehensive medical, dental, and behavioral health services. They aim to provide accessible healthcare to all, regardless of ability to pay.


  8. TE Connectivity
    Average Salary: $70,220
    TE Connectivity is a global technology and manufacturing leader creating sensor and connectivity solutions. They serve automotive, industrial, and consumer applications with a focus on innovation.


  9. Granite Hills Healthcare & Wellness Centre
    Average Salary: $69,139
    Granite Hills Healthcare & Wellness Centre offers skilled nursing, rehabilitation, and long-term care services. They are committed to providing high-quality care and improving the lives of their residents.


  10. Grossmont/Cuyamaca Community College District
    Average Salary: $68,524
    Grossmont/Cuyamaca Community College District provides higher education opportunities through two colleges, offering a wide range of academic programs and services to the community.

How does the cost of living in El Cajon, CA compare to the national average?

El Cajon, CA, boasts a cost of living index that is 136% of the nationwide average, indicating higher housing expenses. Other categories like groceries and transportation also exceed the national average, making El Cajon a relatively expensive place to live.
Cost of living comparison graph for El Cajon, CA vs. Nationwide: housing 36% higher, groceries 7% higher, utilities 4% higher, transportation 14% higher, healthcare 3% lower, miscellaneous 4% lower.

El Cajon, CA, presents a cost of living that is notably higher than the nationwide average, which is set at 100. Housing costs in El Cajon stand at 136, indicating that residents pay 36% more than the national average for housing. This significant increase can be a crucial factor for job seekers considering relocation, as housing often represents a major portion of monthly expenses. Groceries in El Cajon are priced at 107, which is 7% above the national average. This slight increase suggests that while food costs are higher, they remain relatively manageable. Utilities in El Cajon are at 104, which is 4% higher than the average, making them slightly more expensive but still within a reasonable range. Transportation costs are at 114, reflecting an increase of 14% over the national average. This could impact the daily commute and overall transportation budget for residents. Healthcare costs in El Cajon are slightly below the national average at 97, which is a 3% decrease. This might offer some relief for those concerned about medical expenses. Lastly, miscellaneous costs are at 96, which is 4% lower than the national average, providing a small advantage in this category.

Compare Salaries

What are other cities like?
Compare different cities.
Select a city
Thank you! Your submission has been received!
Oops! Something went wrong while submitting the form.
a hand paying employees
Pasadena, TX
Pasadena, TX, boasts a cost of living index that is 94.4% of the nationwide average, making it a relatively affordable place to live. This index reflects a balanced distribution across various categories, including housing, groceries, and utilities, offering a cost-effective living option for professionals.
Learn more
Pearland, TX
Pearland, TX, presents a cost of living index that is 98% of the nationwide average, indicating a slightly lower cost of living. This makes it an attractive option for those seeking a balance between affordability and quality of life.
Learn more
Pembroke Pines, FL
Pembroke Pines, FL, exhibits a cost of living index that is 10% higher than the nationwide average, primarily driven by elevated housing costs. Other categories like groceries and transportation also slightly exceed the national average, while utilities and healthcare remain close to it.
Learn more
Pflugerville, TX
Pflugerville, TX, presents a cost of living index that is 95% of the nationwide average, indicating a slightly lower overall cost of living. This makes it an attractive option for those seeking a balance between affordability and quality of life.
Learn more
Pinellas Park, FL
Pinellas Park, FL, boasts a cost of living index that is 97% of the nationwide average, reflecting a slightly lower overall cost of living. Notably, the housing and utilities sectors contribute to this favorable comparison, with indices of 95% and 96%, respectively.
Learn more
Plano, TX
Plano, TX, exhibits a cost of living index of 105, which is 5% higher than the nationwide average of 100. This suggests that overall expenses in Plano are slightly above the national standard.
Learn more
Plantation, FL
Plantation, FL, exhibits a cost of living index that is 12% higher than the nationwide average, primarily driven by elevated housing costs. Other categories like groceries and transportation also slightly exceed the national average, while utilities and healthcare remain relatively close to it.
Learn more
Pomona, CA
Pomona, CA, exhibits a cost of living index that is 52% higher than the nationwide average, primarily driven by elevated housing costs. Other categories like groceries and utilities also show slight increases, while healthcare costs remain below the national average.
Learn more
Pompano Beach, FL
Pompano Beach, FL, exhibits a cost of living index that is 10% higher than the nationwide average, primarily driven by elevated housing costs. Other categories like groceries and transportation also surpass the national average, while utilities and healthcare remain slightly below.
Learn more
Puyallup, WA
Puyallup, WA, exhibits a cost of living index that is 10% higher than the nationwide average, primarily driven by elevated housing costs. Other categories like groceries and miscellaneous expenses also surpass the national average, while utilities and transportation remain relatively close to the benchmark.
Learn more
Quincy, MA
Quincy, MA, exhibits a higher cost of living compared to the nationwide average, with an overall index of 125%. This indicates that residents can expect to spend 25% more across various living expenses.
Learn more
Rancho Cordova, CA
The cost of living index in Rancho Cordova, CA, stands at 115%, surpassing the nationwide average by 15%. This indicates that living expenses in Rancho Cordova are generally higher than the national average.
Learn more
Redmond, WA
Redmond, WA, exhibits a cost of living index that is 45% higher than the nationwide average, primarily driven by elevated housing costs. Other categories such as groceries and miscellaneous expenses also surpass the national average, though to a lesser extent.
Learn more
Renton, WA
The cost of living index in Renton, WA, stands at 120, which is 20% higher than the nationwide average of 100. This elevated index reflects higher expenses in various sectors, including housing and healthcare.
Learn more
Richardson, TX
The cost of living index in Richardson, TX, stands at 105, which is 5% higher than the nationwide average of 100. This indicates that overall expenses in Richardson are slightly above the national average.
Learn more
Riverside, CA
Riverside, CA, exhibits a cost of living index that is 23% higher than the nationwide average, primarily driven by elevated housing costs. This makes Riverside a noteworthy location for job seekers considering the overall living expenses.
Learn more
Roseville, CA
Roseville, CA, exhibits a higher cost of living compared to the nationwide average, with a cost of living index of 128. This indicates that living expenses in Roseville are 28% above the national average.
Learn more
Round Rock, TX
The cost of living index in Round Rock, TX, stands at 101, slightly above the nationwide average of 100. Housing, groceries, and healthcare costs are notably higher, while utilities and transportation costs are relatively lower.
Learn more
Sacramento, CA
Sacramento, CA, exhibits a cost of living index that is 10% higher than the nationwide average, primarily driven by elevated housing costs. Despite this, other categories like groceries and utilities remain relatively close to the national average.
Learn more
Sammamish, WA
Sammamish, WA, exhibits a cost of living index that is 72% higher than the nationwide average, primarily driven by a 72% increase in housing costs. Other categories like groceries and utilities also show above-average expenses, making it a significant consideration for job seekers.
Learn more
San Antonio, TX
San Antonio, TX, boasts a cost of living index that is 92% of the nationwide average, making it a more affordable option for many professional job seekers. This index reflects lower housing costs and competitive prices across other essential categories.
Learn more
San Diego, CA
San Diego, CA, exhibits a cost of living index that is 46% higher than the nationwide average, primarily driven by elevated housing costs. Other categories like groceries and transportation also surpass the national average, contributing to the overall higher living expenses.
Learn more
San Jose, CA
San Jose, CA, exhibits a higher cost of living compared to the nationwide average, with an overall index of 139.8. This represents a 39.8% increase over the national average of 100.
Learn more
San Marcos, CA
San Marcos, CA, exhibits a higher cost of living compared to the nationwide average, with an overall index of 118. Housing costs notably stand at 62% above the national average, making it a significant factor in the city's elevated cost of living.
Learn more
San Marcos, TX
San Marcos, TX, boasts a cost of living index that is 94% of the nationwide average, reflecting a generally affordable living environment. This index, derived from housing, groceries, utilities, transportation, healthcare, and miscellaneous expenses, positions San Marcos as a competitive choice for cost-conscious professionals.
Learn more
Sanford, FL
Sanford, FL, boasts a cost of living index that is 95% of the nationwide average, indicating a slightly lower cost of living in this area. This makes Sanford an attractive option for those seeking a more affordable lifestyle without compromising on quality.
Learn more
Santa Clara, CA
Santa Clara, CA, boasts a cost of living index that is 189.9% of the nationwide average, reflecting significantly higher expenses, particularly in housing. This elevated index underscores the importance of considering these costs when planning a move to the area.
Learn more
Santa Clarita, CA
Santa Clarita, CA, exhibits a higher cost of living compared to the nationwide average, with an overall index of 116. This indicates that living expenses in Santa Clarita are 16% above the national average.
Learn more
Schertz, TX
Schertz, TX, boasts a cost of living index that is 96% of the nationwide average, making it a slightly more affordable option for professional job seekers. Notably, housing costs in Schertz are 5% below the national average, offering a potential advantage for those relocating.
Learn more
Seattle, WA
Seattle, WA, exhibits a higher cost of living compared to the nationwide average, with an overall index of 128. This indicates that living expenses in Seattle are approximately 28% greater than the national average.
Learn more
Shoreline, WA
Shoreline, WA, exhibits a cost of living index that is 165% of the nationwide average in housing, reflecting a significant premium. Other categories like groceries and transportation also surpass the average, with indices at 110% and 120%, respectively.
Learn more
Somerville, MA
Somerville, MA, exhibits a cost of living index that is 17.3% higher than the nationwide average, primarily driven by elevated housing costs. Other categories like groceries and utilities remain close to the national average, making Somerville a competitive option for those prioritizing specific living expenses.
Learn more
Spokane Valley, WA
Spokane Valley, WA, presents a cost of living index of 98, which is slightly below the nationwide average of 100. This indicates that living expenses in Spokane Valley are generally 2% lower than the national average.
Learn more
Spokane, WA
Spokane, WA, presents a cost of living index that is 90% of the nationwide average, indicating a relatively affordable living environment for job seekers. This index reflects lower costs in housing and miscellaneous expenses, making it an attractive option for those seeking a balanced lifestyle.
Learn more
Springfield, MA
Springfield, MA, boasts a cost of living index that is 91% of the nationwide average, indicating a relatively affordable living environment for professional job seekers. Notably, housing costs are 22% below the national average, making it an attractive option for those seeking budget-friendly housing.
Learn more
Sugar Land, TX
The cost of living index in Sugar Land, TX, stands at 99, slightly below the nationwide average of 100. This indicates that living expenses in Sugar Land are nearly on par with the national average.
Learn more
Sunnyvale, CA
Sunnyvale, CA, exhibits a significantly higher cost of living compared to the nationwide average, with an overall index of 165. This represents a 65% increase over the national benchmark of 100.
Learn more
Tacoma, WA
Tacoma, WA, exhibits a higher cost of living compared to the nationwide average, with an overall index of 110. This indicates that living expenses in Tacoma are 10% above the national average.
Learn more
Tallahassee, FL
The cost of living index in Tallahassee, FL, stands at 91, which is 1% below the nationwide average of 100. This slight decrease suggests that living expenses in Tallahassee are marginally more affordable than the average American city.
Learn more
Tampa, FL
Tampa, FL, boasts a cost of living index that is 96% of the nationwide average, making it a relatively affordable place to live. Housing, groceries, and miscellaneous costs are slightly below the national average, while transportation costs are slightly above.
Learn more
The Colony, TX
The Colony, TX, boasts a cost of living index of 95, which is 5% lower than the nationwide average of 100. This makes it an attractive option for those seeking a more affordable living environment.
Learn more
The Woodlands, TX
The Woodlands, TX, exhibits a cost of living index that is 10% higher than the nationwide average, primarily driven by housing costs. Other categories like groceries and transportation remain slightly below the national average.
Learn more
Torrance, CA
The cost of living index in Torrance, CA, stands at 138, surpassing the nationwide average of 100. This indicates that living expenses in Torrance are 38% higher than the national average.
Learn more
Tukwila, WA
Tukwila, WA, exhibits a cost of living index that is 34% higher than the nationwide average in housing, while other categories like groceries and healthcare remain relatively close to the national average, making it a balanced consideration for job seekers.
Learn more
Vancouver, WA
Vancouver, WA's cost of living index stands at 98, slightly below the nationwide average of 100. This indicates that living expenses in Vancouver are generally 2% less than the national average.
Learn more
Vista, CA
The cost of living index in Vista, CA, stands at 124, which is 24% higher than the nationwide average of 100. This elevated index reflects higher expenses, particularly in housing, which is 79% above the national average.
Learn more
Westfield, MA
Westfield, MA, presents a cost of living index that is 98% of the nationwide average, indicating a slightly lower overall cost of living. Housing and miscellaneous expenses are notably lower, while utilities and healthcare costs are marginally higher.
Learn more
Weston, FL
Weston, FL, exhibits a cost of living index that is 15% higher than the nationwide average, primarily driven by elevated housing costs. Other categories like groceries and transportation also show modest increases, while utilities and healthcare remain close to the national average.
Learn more
Worcester, MA
Worcester, MA, presents a cost of living index that is 99% of the nationwide average, indicating a slightly lower cost of living in most areas. Notably, housing and utilities are below the national average, while groceries and transportation exceed it.
Learn more

There are 876 job openings in El Cajon, CA, today!

Take a deeper dive into the job market in El Cajon, CA

Discover what it's like to work in El Cajon, CA. Learn if you need a car, explore popular employers, the job market, and the best neighborhoods to live in.

City
Overview
El Cajon, CA
876 job openings