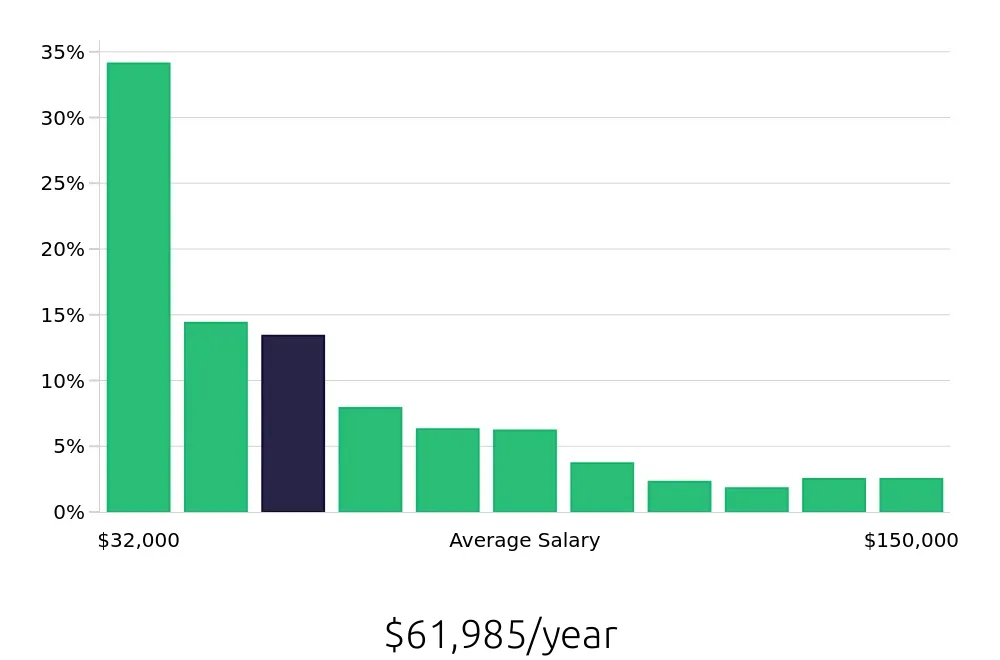
The average salary in Cranford, NJ is $61,985 per year.
In Cranford, NJ, job seekers can find competitive salary ranges across various industries. The average yearly salary in the area is around $61,985, which provides a good standard of living. Workers in higher-paying sectors, such as finance and technology, enjoy salaries that can exceed the average.
The distribution of salaries in Cranford, NJ, showcases a balanced spread. The largest percentage, 34.10%, of employees earn between $32,000 and $42,727 annually. Other significant groups include those making $53,455 to $64,182, which accounts for 14.38% of the workforce. This variety offers multiple opportunities for different skill levels and experiences to find a suitable match.