City
Salary

What is the average salary in Lynnfield, MA?

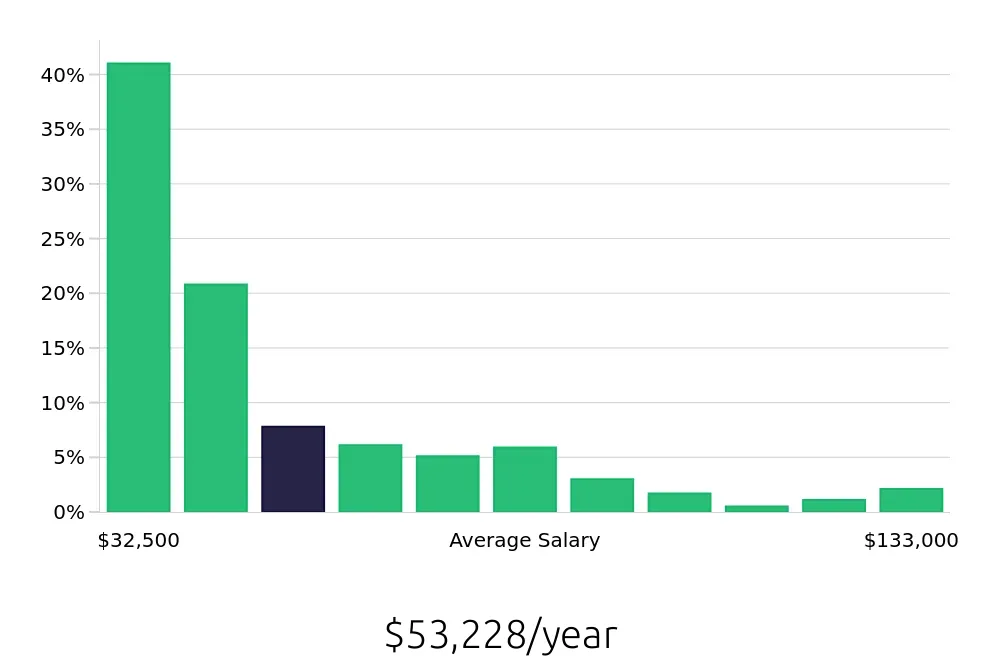
The average salary in Lynnfield, MA is $53,290 per year.

In Lynnfield, MA, the average yearly salary stands at $53,290. This figure provides a clear picture of the earning potential for many job seekers looking at opportunities in the area. The range of salaries varies significantly, with the lowest at $32,580 and the highest reaching up to $127,600.


The salary distribution highlights the diversity in job opportunities. Around 39.95% of salaries fall between $32,580 and $41,218. About 18.54% earn between $41,218 and $49,856. Moving higher, 9.04% of jobs pay between $49,856 and $58,495, while 6.38% earn between $58,495 and $67,133. A smaller percentage of individuals see salaries ranging from $67,133 to $75,771, at 6.05%. Smaller still, 4.23% earn between $75,771 and $84,409. The remaining brackets, each with less than 2% of the population, show salaries between $84,409 and $127,600. This range of earnings provides a comprehensive view of potential compensation for various roles in Lynnfield.

View jobs in Lynnfield, MA

What are the best paying jobs in Lynnfield, MA?

For job seekers in Lynnfield, MA, the highest paying roles often include Behavior Analysts, who earn an average salary of $79,163. This profession involves working with individuals to improve their behavioral patterns, requiring specialized skills and often a degree in psychology or a related field. Another top-paying job is that of a Registered Behavior Technician, with an average salary of $50,499. These professionals assist behavior analysts in implementing treatment plans and supporting clients in their homes or schools. Additionally, Sales Associates and Team Members also provide competitive wages, with average earnings around $42,002 and $39,525, respectively. These positions offer the chance to work in dynamic environments and develop strong customer interaction skills. Job seekers looking for well-paying opportunities in Lynnfield may find these roles both rewarding and lucrative.
Graph displaying best paying job salaries in Lynnfield, MA, highlighting Behavior Analyst with the highest at $79,163 and Team Member with the lowest at $39,525.
  1. Behavior Analyst
    Average Salary: $79,163
    This role involves working with individuals to improve their behavior. It often involves working in schools or clinics. Companies in Lynnfield offer opportunities for career growth and specialization.
    Find Behavior Analyst jobs in Lynnfield, MA


  2. Registered Behavior Technician
    Average Salary: $50,499
    Supporting behavior analysts, this position focuses on implementing behavior plans. The work is impactful and allows for close interaction with clients. Local healthcare centers provide a collaborative environment for this role.
    Find Registered Behavior Technician jobs in Lynnfield, MA


  3. Sales Associate
    Average Salary: $42,002
    Helping customers find products and providing excellent service is key. This role offers the chance to work in retail stores. Lynnfield's retail scene includes popular brands that value customer experience.
    Find Sales Associate jobs in Lynnfield, MA


  4. Team Member
    Average Salary: $39,525
    Everyday tasks include serving customers and maintaining store cleanliness. This position provides a solid foundation in customer service. Many restaurants and fast-food chains in Lynnfield offer this opportunity.
    Find Team Member jobs in Lynnfield, MA

What are the best paying jobs in Lynnfield, MA without a degree?

Top-paying jobs in Lynnfield, MA, that do not require a degree, include Server, Line Cook, and Barista. These roles offer competitive wages and often provide opportunities for advancement with experience. Servers earn an average salary of $48,293, while Line Cooks make $42,284. Baristas, who serve coffee and food, average $37,802 annually. Dishwashers, who clean dishes and utensils, earn around $37,797 a year. These jobs can provide a stable income and a chance to gain valuable skills.
Graph displaying best paying job salaries in Lynnfield, MA without a degree, highlighting Server with the highest at $48,293 and Dishwasher with the lowest at $37,797.
  1. Server
    Average Salary: $48,293
    Serving patrons in a bustling environment, this role involves taking orders, serving food and drinks, and ensuring a positive dining experience. Many local restaurants look for servers who can work efficiently under pressure. Positions available at various establishments.
    Find Server jobs in Lynnfield, MA


  2. Line Cook
    Average Salary: $42,284
    Working in fast-paced kitchens, this job requires preparing ingredients and cooking meals to meet high standards. Attention to detail and speed are crucial. Opportunities exist in numerous dining spots that emphasize quality cuisine.
    Find Line Cook jobs in Lynnfield, MA


  3. Barista
    Average Salary: $37,802
    Creating and serving coffee and other beverages, this role demands precision and a friendly demeanor. Working in coffee shops, baristas must be knowledgeable about various drinks and customer service. Local cafes offer a variety of environments to fit different preferences.
    Find Barista jobs in Lynnfield, MA


  4. Dishwasher
    Average Salary: $37,797
    Cleaning dishes, utensils, and kitchen equipment, this position plays a vital role in maintaining a clean dining area. Attention to detail and efficiency are key. Positions available in many local eateries ensuring a steady work environment.
    Find Dishwasher jobs in Lynnfield, MA

Which companies offer the top salaries in Lynnfield, MA?

Companies in Lynnfield, MA, offer various salary opportunities for job seekers. LifeStance Health leads with an average salary of $101,965. This makes it one of the best-paying options in the area. Johnson Controls follows closely with an average salary of $79,658, also providing competitive wages. Lynnfield Public Schools and Whole Foods Market offer average salaries of $56,647 and $44,665, respectively. These companies still provide decent compensation and benefits. Each employer offers a unique chance for professionals to grow their careers while earning a good income.
Graph displaying company salaries in Lynnfield, MA, highlighting LifeStance Health with the highest at $101,965 and Whole Foods Market with the lowest at $44,665.
  1. LifeStance Health
    Average Salary: $101,965
    LifeStance Health offers healthcare services. They focus on mental and behavioral health. Employees find this job rewarding and well-paid.


  2. Johnson Controls
    Average Salary: $79,658
    Johnson Controls works in smart, healthy buildings. They value innovation and employee development. This is a great place for career growth.


  3. Lynnfield Public Schools
    Average Salary: $56,647
    Lynnfield Public Schools provide education to students. They offer a supportive work environment. Teachers here enjoy competitive pay.


  4. Whole Foods Market
    Average Salary: $44,665
    Whole Foods Market sells natural and organic foods. They promote a healthy lifestyle. Employees here appreciate their work culture.

How does the cost of living in Lynnfield, MA compare to the national average?

Lynnfield, MA, has a cost of living index that exceeds the nationwide average by a notable margin. The index stands at 143, which is 43% higher than the baseline of 100. This elevated index affects various aspects of living, including housing, groceries, utilities, transportation, healthcare, and miscellaneous expenses, making it crucial for job seekers to consider these costs when evaluating opportunities in the area. The housing index in Lynnfield is particularly high at 143, which means housing costs are 43% above the national average. Other categories such as groceries (115), utilities (112), transportation (110), healthcare (130), and miscellaneous expenses (120) also reflect increases ranging from 10% to 43% over the nationwide average. These figures highlight the financial considerations prospective residents and job seekers should keep in mind when planning their move.
Cost of living comparison graph for Lynnfield, MA vs. Nationwide: housing 43% higher, groceries 15% higher, utilities 12% higher, transportation 10% higher, healthcare 30% higher, miscellaneous 20% higher.

The cost of living index in Lynnfield, MA, provides valuable insights for job seekers considering this area. Housing costs in Lynnfield stand at 143, which is 43% higher than the nationwide average. This means that housing expenses in Lynnfield are significantly greater than those found across the country. Individuals need to be aware of this considerable increase when planning their budgets.


Other essential costs also reflect a similar trend. Groceries cost 115, which is 15% higher than the average. Utilities are at 112, 12% above the national benchmark. Transportation costs are slightly elevated at 110, which is 10% more than the average. Additionally, healthcare costs are 30% higher, with an index of 130, and miscellaneous expenses are 20% above average, standing at 120. Job seekers should consider these figures when evaluating the overall cost of living in Lynnfield, MA, compared to the national average.

There are 108 job openings in Lynnfield, MA, today!

Take a deeper dive into the job market in Lynnfield, MA

Discover what it's like to work in Lynnfield, MA. Learn if you need a car, explore popular employers, the job market, and the best neighborhoods to live in.
City
Overview
Lynnfield, MA
108 Job Openings