City
Salary

What is the average salary in Ripon, CA?

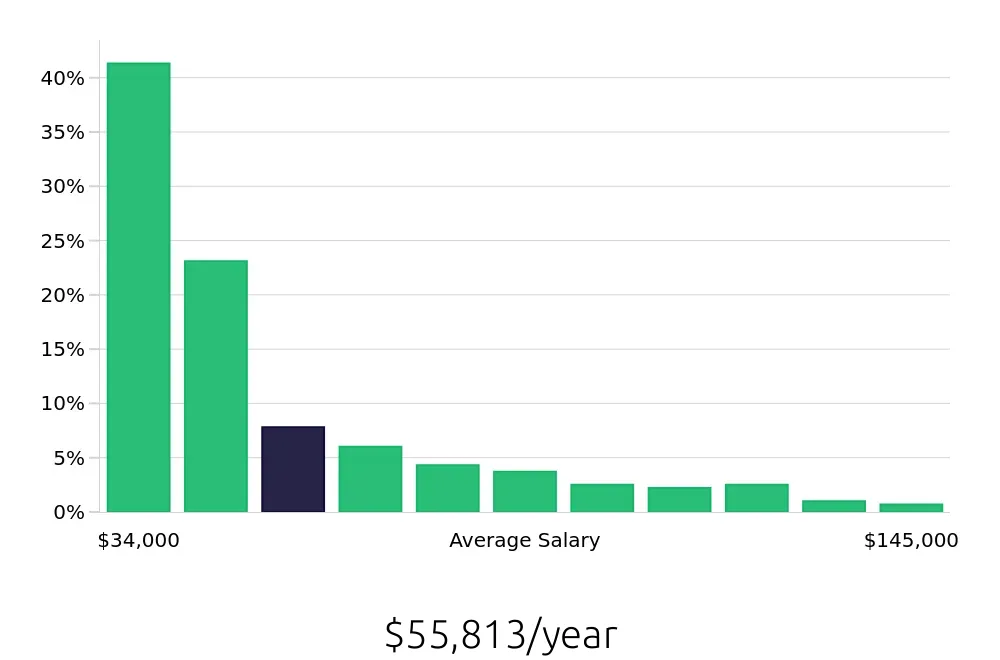
The average salary in Ripon, CA is $55,798 per year.

In Ripon, CA, the average yearly salary is $55,798. This figure shows the central tendency of earnings in the area. For those seeking employment, it offers a good baseline to understand what salary expectations may be. The salaries listed range widely, which means there are various job opportunities available at different pay levels.


Some of the most common salary brackets in Ripon, CA, are as follows:

  • $33,800 to $43,909
  • $54,018 to $64,127
  • $74,236 to $84,345
  • $94,455 to $104,564
These ranges show the variety of jobs in Ripon, from entry-level to mid-career positions. Higher salaries are available for those with more experience or specialized skills.

View jobs in Ripon, CA

What are the best paying jobs in Ripon, CA?

Looking for the best-paying jobs in Ripon, CA? Consider roles like General Manager, Delivery Driver, and Team Member. A General Manager typically earns an average salary of about $64,347 per year. This position offers leadership and oversight, making it one of the top earners. Delivery Drivers also have a good income, earning around $42,954 per year, with flexibility and the chance to be on the road. Team Members earn about $42,567 annually, providing a stable and often entry-level income. These jobs offer various opportunities to suit different skill sets and career goals.
Graph displaying best paying job salaries in Ripon, CA, highlighting General Manager with the highest at $64,347 and Team Member with the lowest at $42,567.
  1. General Manager
    Average Salary: $64,347
    Oversee daily operations and manage staff in various local businesses. Work in a dynamic environment with companies like Ripon's hotels and restaurants. Ensure smooth business operations and customer satisfaction.
    Find General Manager jobs in Ripon, CA


  2. Delivery Driver
    Average Salary: $42,954
    Deliver goods to customers efficiently. Work with local businesses, making timely deliveries. Enjoy flexible hours and the chance to interact with different clients.
    Find Delivery Driver jobs in Ripon, CA


  3. Team Member
    Average Salary: $42,567
    Provide excellent service to customers in a bustling environment. Join teams at local retail stores and food service locations. Gain valuable customer service experience and teamwork skills.
    Find Team Member jobs in Ripon, CA

What are the best paying jobs in Ripon, CA without a degree?

Job seekers in Ripon, CA, have access to several top-paying positions that do not demand a college degree. Baristas in Ripon enjoy an average salary of $43,240. Servers can expect to earn around $35,032 per year. Dishwashes generally make close to $32,385 annually. These roles offer strong earning potential and can be a solid choice for those looking to start or advance their careers without a degree.
Graph displaying best paying job salaries in Ripon, CA without a degree, highlighting Barista with the highest at $43,240 and Dishwasher with the lowest at $32,385.
  1. Barista
    Average Salary: $43,240
    This role is perfect for those who enjoy making coffee and working in a fast-paced environment. Local cafes and coffee shops offer opportunities to connect with the community. A great way to gain experience in customer service.
    Find Barista jobs in Ripon, CA


  2. Server
    Average Salary: $35,032
    Servers work in restaurants, providing excellent service to guests. This job is ideal for those who like to interact with people and work in a team. It's also a great way to learn about the food industry.
    Find Server jobs in Ripon, CA


  3. Dishwasher
    Average Salary: $32,385
    A dishwasher cleans dishes and maintains kitchen hygiene. This job is important for keeping the kitchen running smoothly. It's a good starting point for those interested in food service work.
    Find Dishwasher jobs in Ripon, CA

Which companies offer the top salaries in Ripon, CA?

Ripon, CA, offers competitive salaries at top-paying companies like The Wine Group and Pilot Flying J. The Wine Group stands out with an average salary of $77,331. This figure is significantly higher than Pilot Flying J, which offers an average salary of $59,857. Job seekers can explore these options for rewarding career opportunities in the area.
Graph displaying company salaries in Ripon, CA, highlighting The Wine Group with the highest at $77,331 and Pilot Flying J with the lowest at $59,857.
  1. The Wine Group
    Average Salary: $77,331
    The Wine Group is a leading company in the wine industry. They focus on producing, marketing, and distributing wines. This company offers a competitive salary and various benefits to its employees.


  2. Pilot Flying J
    Average Salary: $59,857
    Pilot Flying J is one of the largest truck stop chains in the country. They provide fuel, food, and services for truckers and travelers. This company is known for its family atmosphere and offers a stable income with good benefits.

How does the cost of living in Ripon, CA compare to the national average?

The cost of living in Ripon, CA, exceeds the nationwide average by 30%. This high index reflects a general trend of elevated expenses, particularly in housing, where the index reaches 130. While groceries and utilities hover around 105, transportation also slightly surpasses the average at 110. Healthcare costs are more affordable at 95, and miscellaneous expenses align with the national average of 100.
Cost of living comparison graph for Ripon, CA vs. Nationwide: housing 30% higher, groceries 5% higher, utilities 5% higher, transportation 10% higher, healthcare 5% lower, miscellaneous 0% lower.

The cost of living index in Ripon, CA, reveals several interesting comparisons to the nationwide average, which is indexed at 100. Housing costs in Ripon stand at 130, which means they are 30% higher than the national average. This makes housing one of the more expensive categories in Ripon, likely influencing decisions for those considering relocation to this area.


When it comes to groceries, Ripon's index is 105, indicating a 5% increase above the national average. Utilities and transportation also show slight increases, with utilities at 105 and transportation at 110, which translates to 5% and 10% more than the national average, respectively. Healthcare costs are relatively lower, with an index of 95, reflecting a 5% decrease from the national average. Miscellaneous expenses match the national average at 100, indicating no change. These data points provide a clear picture for job seekers evaluating their budget needs in Ripon, CA.

There are 43 job openings in Ripon, CA, today!

Take a deeper dive into the job market in Ripon, CA

Discover what it's like to work in Ripon, CA. Learn if you need a car, explore popular employers, the job market, and the best neighborhoods to live in.
City
Overview
Ripon, CA
43 Job Openings