Salaries in Cupertino, CA

Updated on Apr 14, 2025
City
Salary

What is the average salary in Cupertino, CA?

The average salary in Cupertino, CA is $173,910 per year.

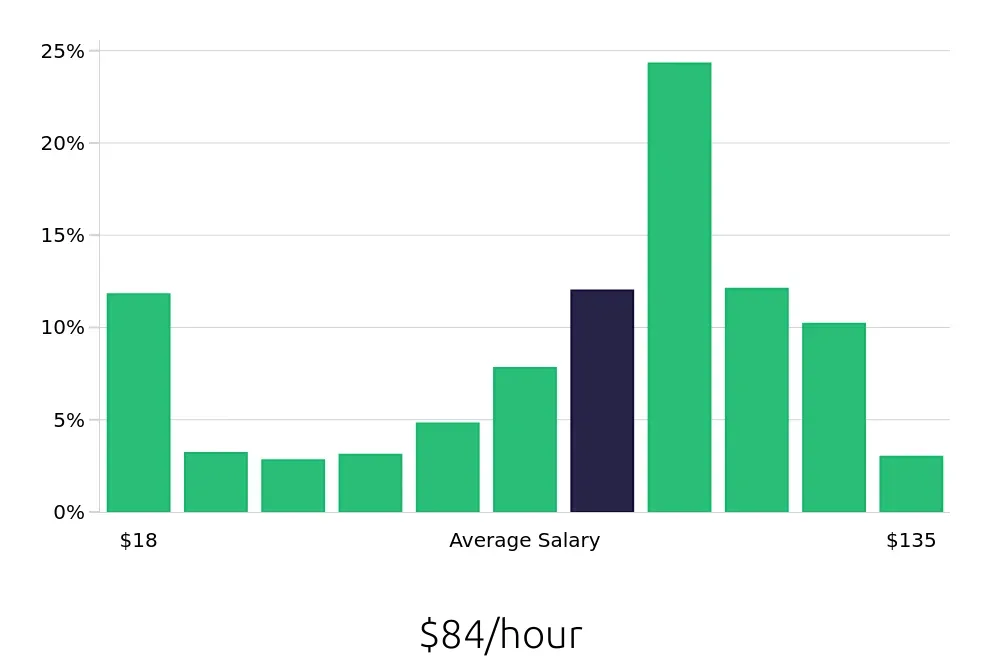
Cupertino, CA, offers a robust job market with competitive salaries across various industries. The average yearly salary in Cupertino stands at approximately $173,910, reflecting a strong economic environment. The salary distribution showcases a wide range, from $38,000 to $281,500, indicating ample opportunities for professionals at different career stages. Notably, the tech sector, with its prominent presence in Cupertino, contributes significantly to these high earnings. Job seekers can expect a favorable salary landscape, with many positions offering above-average compensation. This makes Cupertino an attractive destination for those seeking both professional growth and financial stability.

View Jobs in Cupertino, CA

What are the best paying jobs in Cupertino, CA?

Cupertino offers a range of high-paying job opportunities, particularly in tech and engineering fields. Leading the list are Solutions Architects and Architects, both with average salaries exceeding $235,000. Other top-paying positions include Product Designers, Machine Learning Engineers, and Research Engineers, all reflecting the city's strong tech industry presence. These roles not only promise competitive compensation but also the chance to work with cutting-edge technology.
Graph displaying best paying job salaries in Cupertino, CA, highlighting Solutions Architect with the highest at $235,752 and Electrical Engineer with the lowest at $205,582.
  1. Solutions Architect
    Average Salary: $235,752
    This role involves designing and implementing solutions for tech companies. It requires strong problem-solving skills and the ability to work with clients. Companies like Apple and Google offer exciting opportunities.
    Find Solutions Architect jobs in Cupertino, CA


  2. Architect
    Average Salary: $235,229
    Architects create designs and plans for buildings and structures. They work with clients to ensure the design meets their needs. Cupertino has many opportunities in this field with companies like Apple.
    Find Architect jobs in Cupertino, CA


  3. Product Designer
    Average Salary: $220,940
    Product designers create and develop products, ensuring they meet user needs. They work closely with engineers and marketers. Cupertino offers many opportunities in this field with companies like Apple.
    Find Product Designer jobs in Cupertino, CA


  4. Machine Learning Engineer
    Average Salary: $216,619
    Machine learning engineers develop and implement machine learning models. They work with data scientists and software engineers. Cupertino offers many opportunities in this field with companies like Apple.
    Find Machine Learning Engineer jobs in Cupertino, CA


  5. Research Engineer
    Average Salary: $213,402
    Research engineers conduct research and development to improve products and services. They work with scientists and engineers. Cupertino offers many opportunities in this field with companies like Apple.
    Find Research Engineer jobs in Cupertino, CA


  6. Data Scientist
    Average Salary: $211,906
    Data scientists analyze and interpret complex data to help companies make informed decisions. They work with data engineers and business analysts. Cupertino offers many opportunities in this field with companies like Apple.
    Find Data Scientist jobs in Cupertino, CA


  7. Integration Engineer
    Average Salary: $210,609
    Integration engineers ensure that different systems and software work together seamlessly. They work with software developers and system administrators. Cupertino offers many opportunities in this field with companies like Apple.
    Find Integration Engineer jobs in Cupertino, CA


  8. Security Engineer
    Average Salary: $209,352
    Security engineers protect systems and data from cyber threats. They work with IT teams and security analysts. Cupertino offers many opportunities in this field with companies like Apple.
    Find Security Engineer jobs in Cupertino, CA


  9. Reliability Engineer
    Average Salary: $209,041
    Reliability engineers ensure that products and systems are reliable and perform well. They work with quality assurance teams and engineers. Cupertino offers many opportunities in this field with companies like Apple.
    Find Reliability Engineer jobs in Cupertino, CA


  10. Electrical Engineer
    Average Salary: $205,582
    Electrical engineers design and develop electrical systems and equipment. They work with other engineers and technicians. Cupertino offers many opportunities in this field with companies like Apple.
    Find Electrical Engineer jobs in Cupertino, CA

What are the best paying jobs in Cupertino, CA without a degree?

Cupertino offers a range of high-paying jobs that do not require a degree, making it an attractive location for job seekers. Roles such as Restaurant Manager, Line Cook, and Housekeeping can provide competitive salaries, with opportunities to advance and grow within the industry. These positions offer a solid starting point for those looking to enter the workforce without the need for formal education.
Graph displaying best paying job salaries in Cupertino, CA without a degree, highlighting Restaurant Manager with the highest at $46,408 and Kitchen Team Member with the lowest at $37,048.
  1. Restaurant Manager
    Average Salary: $46,408
    Manage daily operations, oversee staff, and ensure customer satisfaction. Work in high-end restaurants and cafes. Gain experience in a tech-driven environment.
    Find Restaurant Manager jobs in Cupertino, CA


  2. Line Cook
    Average Salary: $45,566
    Prepare ingredients and cook food to order. Work in busy kitchens, often in tech company cafeterias. Develop skills in fast-paced, high-demand settings.
    Find Line Cook jobs in Cupertino, CA


  3. Housekeeping
    Average Salary: $45,289
    Clean and maintain facilities. Ensure a clean and welcoming environment. Work in hotels, offices, and residential properties.
    Find Housekeeping jobs in Cupertino, CA


  4. Service Team Member
    Average Salary: $44,092
    Provide excellent customer service. Handle reservations, greet guests, and assist with dining. Experience in a dynamic, tech-centric community.
    Find Service Team Member jobs in Cupertino, CA


  5. Server
    Average Salary: $43,893
    Take orders, serve food and beverages, and ensure customer satisfaction. Work in various dining establishments. Gain experience in a vibrant, tech-driven city.
    Find Server jobs in Cupertino, CA


  6. Barista
    Average Salary: $42,789
    Prepare and serve coffee and other beverages. Work in cafes and coffee shops. Develop skills in a creative and fast-paced environment.
    Find Barista jobs in Cupertino, CA


  7. Dishwasher
    Average Salary: $41,102
    Clean dishes, utensils, and kitchen equipment. Work in busy kitchens. Gain experience in a high-demand, tech-focused area.
    Find Dishwasher jobs in Cupertino, CA


  8. Landscaper
    Average Salary: $38,735
    Maintain and beautify outdoor spaces. Work in parks, gardens, and residential areas. Develop skills in a picturesque, tech-rich environment.
    Find Landscaper jobs in Cupertino, CA


  9. Kitchen Team Member
    Average Salary: $37,048
    Assist with food preparation and cooking. Work in various kitchen settings. Gain experience in a dynamic, tech-driven community.
    Find Kitchen Team Member jobs in Cupertino, CA

Which companies offer the top salaries in Cupertino, CA?

Cupertino, CA, is home to several high-paying companies, with Apple leading the pack at an average salary of $207,514. Amazon Web Services and Amazon.com also offer competitive salaries, making Cupertino an attractive location for job seekers looking for lucrative opportunities.
Graph displaying company salaries in Cupertino, CA, highlighting Apple with the highest at $207,514 and YOUNG SCHOLARS with the lowest at $54,057.
  1. Apple
    Average Salary: $207,514
    Apple is a global technology leader known for its innovative products, including the iPhone, iPad, and Mac computers. The company offers competitive salaries and benefits to attract top talent.


  2. Amazon Web Services
    Average Salary: $167,961
    Amazon Web Services is a cloud computing platform that provides a range of services to businesses and individuals. The company offers competitive salaries and benefits to attract top talent.


  3. Amazon.com
    Average Salary: $152,160
    Amazon is a global e-commerce giant that offers a wide range of products and services. The company offers competitive salaries and benefits to attract top talent.


  4. Kaiser Permanente
    Average Salary: $108,906
    Kaiser Permanente is a healthcare organization that provides medical services to millions of people. The company offers competitive salaries and benefits to attract top talent.


  5. The Forum At Rancho San Antonio
    Average Salary: $69,635
    The Forum At Rancho San Antonio is a shopping center that offers a range of retail and dining options. The company offers competitive salaries and benefits to attract top talent.


  6. Front Porch Communities and Services
    Average Salary: $61,550
    Front Porch Communities and Services is a property management company that provides services to residential communities. The company offers competitive salaries and benefits to attract top talent.


  7. Trident Security Solutions
    Average Salary: $57,679
    Trident Security Solutions is a security services company that provides a range of security solutions to businesses and individuals. The company offers competitive salaries and benefits to attract top talent.


  8. Allied Universal
    Average Salary: $55,000
    Allied Universal is a security services company that provides a range of security solutions to businesses and individuals. The company offers competitive salaries and benefits to attract top talent.


  9. Hilton
    Average Salary: $54,589
    Hilton is a global hospitality company that operates a range of hotels and resorts. The company offers competitive salaries and benefits to attract top talent.


  10. YOUNG SCHOLARS
    Average Salary: $54,057
    YOUNG SCHOLARS is a nonprofit organization that provides educational programs and services to children and families. The company offers competitive salaries and benefits to attract top talent.

How does the cost of living in Cupertino, CA compare to the national average?

Cupertino, CA, exhibits a significantly higher cost of living compared to the nationwide average, with an overall index of 184.8. This represents an 84.8% increase over the national benchmark, where the cost of living is set at 100.
Cost of living comparison graph for Cupertino, CA vs. Nationwide: housing 274% higher, groceries 28% higher, utilities 4% higher, transportation 23% higher, healthcare 6% higher, miscellaneous 39% higher.

Cupertino, California, stands out with a notably higher cost of living compared to the nationwide average, which is indexed at 100. The housing cost in Cupertino is significantly elevated, with an index of 374.6. This figure indicates that housing expenses in Cupertino are nearly four times the national average, making it a critical consideration for potential residents. Groceries in Cupertino also reflect a higher cost, with an index of 128.3, suggesting that grocery expenses are about 28% above the average.


Other areas of living expenses in Cupertino, such as utilities, transportation, healthcare, and miscellaneous costs, also exceed the national average. Utilities have an index of 104.7, which is 4.7% higher than the average. Transportation costs are slightly above average at 123.5, indicating a 23.5% increase. Healthcare costs, while still relatively close to the average, are indexed at 106.9, showing a 6.9% increase. Miscellaneous expenses, including entertainment and personal care, are indexed at 139.7, which is 39.7% higher than the national average. These figures collectively highlight the elevated cost of living in Cupertino, making it essential for job seekers to consider these factors when evaluating potential relocation.

Compare Salaries

What are other cities like?
Compare different cities.
Select a city
Thank you! Your submission has been received!
Oops! Something went wrong while submitting the form.
a hand paying employees
Pasadena, TX
Pasadena, TX, boasts a cost of living index that is 94.4% of the nationwide average, making it a relatively affordable place to live. This index reflects a balanced distribution across various categories, including housing, groceries, and utilities, offering a cost-effective living option for professionals.
Learn more
Pearland, TX
Pearland, TX, presents a cost of living index that is 98% of the nationwide average, indicating a slightly lower cost of living. This makes it an attractive option for those seeking a balance between affordability and quality of life.
Learn more
Pembroke Pines, FL
Pembroke Pines, FL, exhibits a cost of living index that is 10% higher than the nationwide average, primarily driven by elevated housing costs. Other categories like groceries and transportation also slightly exceed the national average, while utilities and healthcare remain close to it.
Learn more
Pflugerville, TX
Pflugerville, TX, presents a cost of living index that is 95% of the nationwide average, indicating a slightly lower overall cost of living. This makes it an attractive option for those seeking a balance between affordability and quality of life.
Learn more
Pinellas Park, FL
Pinellas Park, FL, boasts a cost of living index that is 97% of the nationwide average, reflecting a slightly lower overall cost of living. Notably, the housing and utilities sectors contribute to this favorable comparison, with indices of 95% and 96%, respectively.
Learn more
Plano, TX
Plano, TX, exhibits a cost of living index of 105, which is 5% higher than the nationwide average of 100. This suggests that overall expenses in Plano are slightly above the national standard.
Learn more
Plantation, FL
Plantation, FL, exhibits a cost of living index that is 12% higher than the nationwide average, primarily driven by elevated housing costs. Other categories like groceries and transportation also slightly exceed the national average, while utilities and healthcare remain relatively close to it.
Learn more
Pomona, CA
Pomona, CA, exhibits a cost of living index that is 52% higher than the nationwide average, primarily driven by elevated housing costs. Other categories like groceries and utilities also show slight increases, while healthcare costs remain below the national average.
Learn more
Pompano Beach, FL
Pompano Beach, FL, exhibits a cost of living index that is 10% higher than the nationwide average, primarily driven by elevated housing costs. Other categories like groceries and transportation also surpass the national average, while utilities and healthcare remain slightly below.
Learn more
Puyallup, WA
Puyallup, WA, exhibits a cost of living index that is 10% higher than the nationwide average, primarily driven by elevated housing costs. Other categories like groceries and miscellaneous expenses also surpass the national average, while utilities and transportation remain relatively close to the benchmark.
Learn more
Quincy, MA
Quincy, MA, exhibits a higher cost of living compared to the nationwide average, with an overall index of 125%. This indicates that residents can expect to spend 25% more across various living expenses.
Learn more
Rancho Cordova, CA
The cost of living index in Rancho Cordova, CA, stands at 115%, surpassing the nationwide average by 15%. This indicates that living expenses in Rancho Cordova are generally higher than the national average.
Learn more
Redmond, WA
Redmond, WA, exhibits a cost of living index that is 45% higher than the nationwide average, primarily driven by elevated housing costs. Other categories such as groceries and miscellaneous expenses also surpass the national average, though to a lesser extent.
Learn more
Renton, WA
The cost of living index in Renton, WA, stands at 120, which is 20% higher than the nationwide average of 100. This elevated index reflects higher expenses in various sectors, including housing and healthcare.
Learn more
Richardson, TX
The cost of living index in Richardson, TX, stands at 105, which is 5% higher than the nationwide average of 100. This indicates that overall expenses in Richardson are slightly above the national average.
Learn more
Riverside, CA
Riverside, CA, exhibits a cost of living index that is 23% higher than the nationwide average, primarily driven by elevated housing costs. This makes Riverside a noteworthy location for job seekers considering the overall living expenses.
Learn more
Roseville, CA
Roseville, CA, exhibits a higher cost of living compared to the nationwide average, with a cost of living index of 128. This indicates that living expenses in Roseville are 28% above the national average.
Learn more
Round Rock, TX
The cost of living index in Round Rock, TX, stands at 101, slightly above the nationwide average of 100. Housing, groceries, and healthcare costs are notably higher, while utilities and transportation costs are relatively lower.
Learn more
Sacramento, CA
Sacramento, CA, exhibits a cost of living index that is 10% higher than the nationwide average, primarily driven by elevated housing costs. Despite this, other categories like groceries and utilities remain relatively close to the national average.
Learn more
Sammamish, WA
Sammamish, WA, exhibits a cost of living index that is 72% higher than the nationwide average, primarily driven by a 72% increase in housing costs. Other categories like groceries and utilities also show above-average expenses, making it a significant consideration for job seekers.
Learn more
San Antonio, TX
San Antonio, TX, boasts a cost of living index that is 92% of the nationwide average, making it a more affordable option for many professional job seekers. This index reflects lower housing costs and competitive prices across other essential categories.
Learn more
San Diego, CA
San Diego, CA, exhibits a cost of living index that is 46% higher than the nationwide average, primarily driven by elevated housing costs. Other categories like groceries and transportation also surpass the national average, contributing to the overall higher living expenses.
Learn more
San Jose, CA
San Jose, CA, exhibits a higher cost of living compared to the nationwide average, with an overall index of 139.8. This represents a 39.8% increase over the national average of 100.
Learn more
San Marcos, CA
San Marcos, CA, exhibits a higher cost of living compared to the nationwide average, with an overall index of 118. Housing costs notably stand at 62% above the national average, making it a significant factor in the city's elevated cost of living.
Learn more
San Marcos, TX
San Marcos, TX, boasts a cost of living index that is 94% of the nationwide average, reflecting a generally affordable living environment. This index, derived from housing, groceries, utilities, transportation, healthcare, and miscellaneous expenses, positions San Marcos as a competitive choice for cost-conscious professionals.
Learn more
Sanford, FL
Sanford, FL, boasts a cost of living index that is 95% of the nationwide average, indicating a slightly lower cost of living in this area. This makes Sanford an attractive option for those seeking a more affordable lifestyle without compromising on quality.
Learn more
Santa Clara, CA
Santa Clara, CA, boasts a cost of living index that is 189.9% of the nationwide average, reflecting significantly higher expenses, particularly in housing. This elevated index underscores the importance of considering these costs when planning a move to the area.
Learn more
Santa Clarita, CA
Santa Clarita, CA, exhibits a higher cost of living compared to the nationwide average, with an overall index of 116. This indicates that living expenses in Santa Clarita are 16% above the national average.
Learn more
Schertz, TX
Schertz, TX, boasts a cost of living index that is 96% of the nationwide average, making it a slightly more affordable option for professional job seekers. Notably, housing costs in Schertz are 5% below the national average, offering a potential advantage for those relocating.
Learn more
Seattle, WA
Seattle, WA, exhibits a higher cost of living compared to the nationwide average, with an overall index of 128. This indicates that living expenses in Seattle are approximately 28% greater than the national average.
Learn more
Shoreline, WA
Shoreline, WA, exhibits a cost of living index that is 165% of the nationwide average in housing, reflecting a significant premium. Other categories like groceries and transportation also surpass the average, with indices at 110% and 120%, respectively.
Learn more
Somerville, MA
Somerville, MA, exhibits a cost of living index that is 17.3% higher than the nationwide average, primarily driven by elevated housing costs. Other categories like groceries and utilities remain close to the national average, making Somerville a competitive option for those prioritizing specific living expenses.
Learn more
Spokane Valley, WA
Spokane Valley, WA, presents a cost of living index of 98, which is slightly below the nationwide average of 100. This indicates that living expenses in Spokane Valley are generally 2% lower than the national average.
Learn more
Spokane, WA
Spokane, WA, presents a cost of living index that is 90% of the nationwide average, indicating a relatively affordable living environment for job seekers. This index reflects lower costs in housing and miscellaneous expenses, making it an attractive option for those seeking a balanced lifestyle.
Learn more
Springfield, MA
Springfield, MA, boasts a cost of living index that is 91% of the nationwide average, indicating a relatively affordable living environment for professional job seekers. Notably, housing costs are 22% below the national average, making it an attractive option for those seeking budget-friendly housing.
Learn more
Sugar Land, TX
The cost of living index in Sugar Land, TX, stands at 99, slightly below the nationwide average of 100. This indicates that living expenses in Sugar Land are nearly on par with the national average.
Learn more
Sunnyvale, CA
Sunnyvale, CA, exhibits a significantly higher cost of living compared to the nationwide average, with an overall index of 165. This represents a 65% increase over the national benchmark of 100.
Learn more
Tacoma, WA
Tacoma, WA, exhibits a higher cost of living compared to the nationwide average, with an overall index of 110. This indicates that living expenses in Tacoma are 10% above the national average.
Learn more
Tallahassee, FL
The cost of living index in Tallahassee, FL, stands at 91, which is 1% below the nationwide average of 100. This slight decrease suggests that living expenses in Tallahassee are marginally more affordable than the average American city.
Learn more
Tampa, FL
Tampa, FL, boasts a cost of living index that is 96% of the nationwide average, making it a relatively affordable place to live. Housing, groceries, and miscellaneous costs are slightly below the national average, while transportation costs are slightly above.
Learn more
The Colony, TX
The Colony, TX, boasts a cost of living index of 95, which is 5% lower than the nationwide average of 100. This makes it an attractive option for those seeking a more affordable living environment.
Learn more
The Woodlands, TX
The Woodlands, TX, exhibits a cost of living index that is 10% higher than the nationwide average, primarily driven by housing costs. Other categories like groceries and transportation remain slightly below the national average.
Learn more
Torrance, CA
The cost of living index in Torrance, CA, stands at 138, surpassing the nationwide average of 100. This indicates that living expenses in Torrance are 38% higher than the national average.
Learn more
Tukwila, WA
Tukwila, WA, exhibits a cost of living index that is 34% higher than the nationwide average in housing, while other categories like groceries and healthcare remain relatively close to the national average, making it a balanced consideration for job seekers.
Learn more
Vancouver, WA
Vancouver, WA's cost of living index stands at 98, slightly below the nationwide average of 100. This indicates that living expenses in Vancouver are generally 2% less than the national average.
Learn more
Vista, CA
The cost of living index in Vista, CA, stands at 124, which is 24% higher than the nationwide average of 100. This elevated index reflects higher expenses, particularly in housing, which is 79% above the national average.
Learn more
Westfield, MA
Westfield, MA, presents a cost of living index that is 98% of the nationwide average, indicating a slightly lower overall cost of living. Housing and miscellaneous expenses are notably lower, while utilities and healthcare costs are marginally higher.
Learn more
Weston, FL
Weston, FL, exhibits a cost of living index that is 15% higher than the nationwide average, primarily driven by elevated housing costs. Other categories like groceries and transportation also show modest increases, while utilities and healthcare remain close to the national average.
Learn more
Worcester, MA
Worcester, MA, presents a cost of living index that is 99% of the nationwide average, indicating a slightly lower cost of living in most areas. Notably, housing and utilities are below the national average, while groceries and transportation exceed it.
Learn more

There are 1,588 job openings in Cupertino, CA, today!

Take a deeper dive into the job market in Cupertino, CA

Discover what it's like to work in Cupertino, CA. Learn if you need a car, explore popular employers, the job market, and the best neighborhoods to live in.

City
Overview
Cupertino, CA
1,588 job openings