Salaries in Torrance, CA

Updated on Apr 14, 2025
City
Salary

What is the average salary in Torrance, CA?

The average salary in Torrance, CA is $69,377 per year.

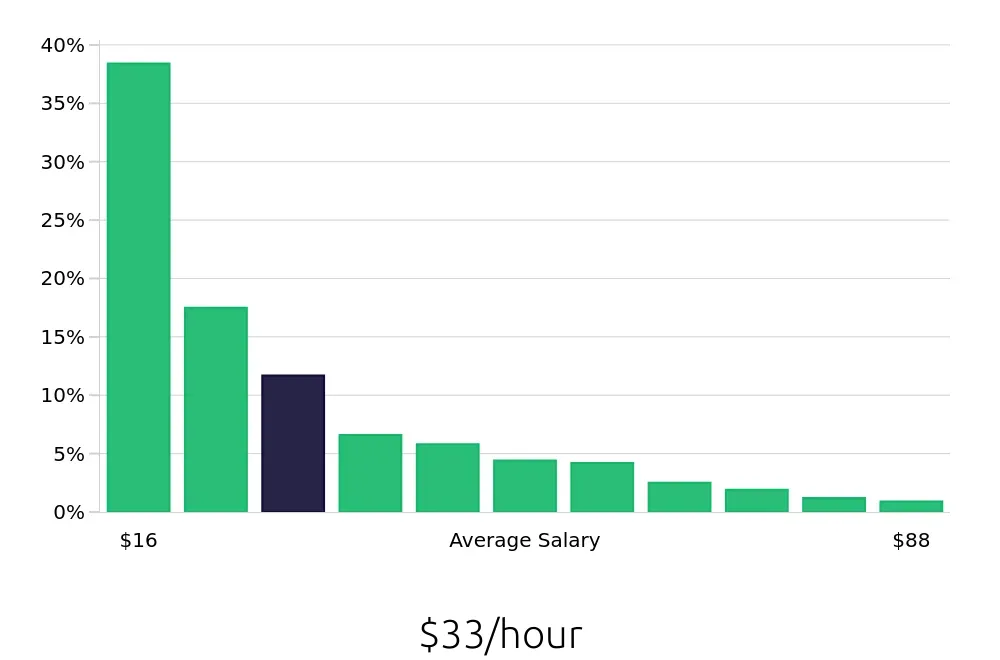
In Torrance, CA, the average yearly salary stands at a commendable $69,377. This figure reflects a diverse range of industries and positions available in the area. The salary distribution shows that 38.4% of positions offer salaries around $32,500, while the highest percentage, 17.5%, corresponds to salaries near $46,091. Notably, the top-tier positions, making up 0.9% of the market, offer salaries upwards of $182,000. This variety suggests a robust job market with opportunities across different pay scales, catering to a wide range of professional aspirations and skill sets.

View Jobs in Torrance, CA

What are the best paying jobs in Torrance, CA?

Torrance offers a range of high-paying job opportunities across various sectors. Leading the list are Nurse Practitioners, Attorneys, and Pharmacists, all boasting average salaries above $140,000. Engineers and Technologists also find lucrative positions in the area, with roles like Electronics Engineer and Nuclear Medicine Technologist providing competitive compensation. These roles reflect the diverse and well-compensated job market in Torrance.
Graph displaying best paying job salaries in Torrance, CA, highlighting Nurse Practitioner with the highest at $154,899 and Controller with the lowest at $121,287.
  1. Nurse Practitioner
    Average Salary: $154,899
    Provide primary and specialty care in various healthcare settings. Work with renowned healthcare providers in the area. Opportunities for professional growth and specialization.
    Find Nurse Practitioner jobs in Torrance, CA


  2. Attorney
    Average Salary: $149,949
    Represent clients in legal matters, offering advice and advocacy. Collaborate with established law firms. Engage in diverse legal practice areas.
    Find Attorney jobs in Torrance, CA


  3. Pharmacist
    Average Salary: $142,853
    Distribute medications and provide health advice to patients. Work in community pharmacies and hospitals. Ensure safe and effective medication use.
    Find Pharmacist jobs in Torrance, CA


  4. Electronics Engineer
    Average Salary: $134,620
    Design and develop electronic systems and components. Collaborate with tech companies and research institutions. Focus on innovation and problem-solving.
    Find Electronics Engineer jobs in Torrance, CA


  5. Software Engineer
    Average Salary: $134,569
    Develop and maintain software applications. Work with tech firms and startups. Focus on coding, testing, and debugging.
    Find Software Engineer jobs in Torrance, CA


  6. Design Engineer
    Average Salary: $131,743
    Design and develop products and systems. Collaborate with manufacturing companies. Focus on creating efficient and innovative solutions.
    Find Design Engineer jobs in Torrance, CA


  7. Systems Engineer
    Average Salary: $131,194
    Integrate and manage complex systems. Work with IT firms and tech companies. Focus on system design, implementation, and maintenance.
    Find Systems Engineer jobs in Torrance, CA


  8. Nuclear Medicine Technologist
    Average Salary: $130,193
    Operate imaging equipment to diagnose and treat diseases. Work in hospitals and diagnostic centers. Ensure patient safety and accurate results.
    Find Nuclear Medicine Technologist jobs in Torrance, CA


  9. Dental Hygienist
    Average Salary: $125,142
    Provide preventive dental care and educate patients. Work in dental clinics and private practices. Focus on maintaining oral health.
    Find Dental Hygienist jobs in Torrance, CA


  10. Controller
    Average Salary: $121,287
    Manage financial operations and ensure compliance. Work with various industries. Focus on budgeting, accounting, and financial reporting.
    Find Controller jobs in Torrance, CA

What are the best paying jobs in Torrance, CA without a degree?

In Torrance, CA, the top-paying jobs without a degree include Restaurant Manager, Floor Manager, and Floor Tech, with average salaries of $58,515, $42,106, and $41,624 respectively. These positions offer competitive compensation and valuable experience in the service industry.
Graph displaying best paying job salaries in Torrance, CA without a degree, highlighting Restaurant Manager with the highest at $58,515 and Line Cook with the lowest at $38,157.
  1. Restaurant Manager
    Average Salary: $58,515
    Manage daily operations, oversee staff, and ensure customer satisfaction. Work in various dining establishments, including local restaurants and cafes.
    Find Restaurant Manager jobs in Torrance, CA


  2. Floor Manager
    Average Salary: $42,106
    Supervise floor staff, handle customer service issues, and ensure smooth operations. Opportunities exist in retail stores and entertainment venues.
    Find Floor Manager jobs in Torrance, CA


  3. Floor Tech
    Average Salary: $41,624
    Maintain cleanliness, set up equipment, and assist with events. Positions available in event spaces, theaters, and concert venues.
    Find Floor Tech jobs in Torrance, CA


  4. Meat Cutter
    Average Salary: $41,513
    Cut, trim, and package meat products. Work in grocery stores and butcher shops, ensuring quality and efficiency.
    Find Meat Cutter jobs in Torrance, CA


  5. Deli Slicer
    Average Salary: $40,031
    Slice and package deli meats, cheeses, and other products. Opportunities in grocery stores and delis, focusing on customer service.
    Find Deli Slicer jobs in Torrance, CA


  6. Housekeeping
    Average Salary: $39,974
    Clean and maintain guest rooms, public areas, and facilities. Work in hotels, motels, and resorts, ensuring a welcoming environment.
    Find Housekeeping jobs in Torrance, CA


  7. Barista
    Average Salary: $39,179
    Prepare and serve coffee and other beverages. Work in coffee shops and cafes, focusing on customer experience and quality.
    Find Barista jobs in Torrance, CA


  8. Kitchen Team Member
    Average Salary: $38,412
    Assist in food preparation, cooking, and kitchen maintenance. Opportunities in restaurants, cafes, and catering services.
    Find Kitchen Team Member jobs in Torrance, CA


  9. Server Assistant
    Average Salary: $38,357
    Support servers by taking orders, delivering food, and maintaining tables. Work in restaurants, cafes, and dining establishments.
    Find Server Assistant jobs in Torrance, CA


  10. Line Cook
    Average Salary: $38,157
    Prepare ingredients, cook food, and maintain kitchen cleanliness. Positions available in restaurants, cafes, and food service establishments.
    Find Line Cook jobs in Torrance, CA

Which companies offer the top salaries in Torrance, CA?

In Torrance, CA, LifeStance Health leads as the top-paying company, offering an average salary of $191,741. Other notable companies include Intellisense Systems Inc and CyberCoders, with average salaries of $137,530 and $127,240 respectively.
Graph displaying company salaries in Torrance, CA, highlighting LifeStance Health with the highest at $191,741 and Optum with the lowest at $103,075.
  1. LifeStance Health
    Average Salary: $191,741
    LifeStance Health is a leading mental health care provider, offering a range of services including psychiatry, therapy, and counseling. They are committed to improving patient outcomes and providing high-quality care.


  2. Intellisense Systems Inc
    Average Salary: $137,530
    Intellisense Systems Inc is a technology company specializing in data analytics and business intelligence solutions. They provide innovative tools to help businesses make data-driven decisions.


  3. CyberCoders
    Average Salary: $127,240
    CyberCoders is a technology staffing and recruitment firm, connecting tech companies with top talent in software development, cybersecurity, and data science.


  4. Herbalife
    Average Salary: $119,626
    Herbalife is a global nutrition company that offers a wide range of health and wellness products. They empower entrepreneurs to build their own businesses through direct selling.


  5. American Honda Motor
    Average Salary: $113,160
    American Honda Motor is the U.S. subsidiary of Honda Motor Company, manufacturing and selling automobiles, motorcycles, and power equipment. They are known for their innovation and quality.


  6. Divergent 3D
    Average Salary: $111,754
    Divergent 3D is a technology company specializing in metal 3D printing solutions. They provide advanced manufacturing technology to industries such as aerospace, automotive, and medical.


  7. Honeywell
    Average Salary: $111,667
    Honeywell is a multinational conglomerate that operates in various sectors, including aerospace, building technologies, and performance materials. They are known for their innovation and quality.


  8. Honda
    Average Salary: $110,507
    Honda is a Japanese multinational corporation manufacturing automobiles, motorcycles, and power equipment. They are known for their innovation, quality, and reliability.


  9. West Coast Dental Services
    Average Salary: $106,896
    West Coast Dental Services is a leading dental care provider, offering a range of services including general dentistry, orthodontics, and cosmetic dentistry. They are committed to providing high-quality care and patient satisfaction.


  10. Optum
    Average Salary: $103,075
    Optum is a health services and innovation company, providing a range of services including healthcare delivery, pharmacy care services, and data analytics. They are committed to improving health outcomes and reducing costs.

How does the cost of living in Torrance, CA compare to the national average?

The cost of living index in Torrance, CA, stands at 138, surpassing the nationwide average of 100. This indicates that living expenses in Torrance are 38% higher than the national average.
Cost of living comparison graph for Torrance, CA vs. Nationwide: housing 95% higher, groceries 18% higher, utilities 12% higher, transportation 20% higher, healthcare 5% higher, miscellaneous 30% higher.

When considering a move to Torrance, California, job seekers will find the cost of living index offers a mixed picture compared to the nationwide average, which is set at 100. Housing costs in Torrance stand significantly higher, at 195, indicating that housing expenses are nearly double the national average. This substantial increase suggests that finding affordable housing may be a challenge, but it also reflects the desirability and competitive nature of the real estate market in the area.


In contrast, other living expenses in Torrance are relatively close to the national average. Groceries, for instance, are priced at 118, which is 18% above the average. Utilities and transportation costs also hover slightly above the national average, with indices of 112 and 120, respectively. Healthcare costs are slightly below average at 105, offering some relief for those concerned about medical expenses. Miscellaneous costs, including entertainment and personal care, are at 130, which is 30% higher than the national average. Overall, while Torrance presents higher costs in certain areas, it also offers competitive pricing in others, making it a balanced consideration for potential residents.

Compare Salaries

What are other cities like?
Compare different cities.
Select a city
Thank you! Your submission has been received!
Oops! Something went wrong while submitting the form.
a hand paying employees
Pasadena, CA
Pasadena, CA, exhibits a higher cost of living compared to the nationwide average, with an overall index of 121. This indicates that living expenses in Pasadena are 21% greater than the national average.
Learn more
Pasadena, TX
Pasadena, TX, boasts a cost of living index that is 94.4% of the nationwide average, making it a relatively affordable place to live. This index reflects a balanced distribution across various categories, including housing, groceries, and utilities, offering a cost-effective living option for professionals.
Learn more
Pearland, TX
Pearland, TX, presents a cost of living index that is 98% of the nationwide average, indicating a slightly lower cost of living. This makes it an attractive option for those seeking a balance between affordability and quality of life.
Learn more
Pembroke Pines, FL
Pembroke Pines, FL, exhibits a cost of living index that is 10% higher than the nationwide average, primarily driven by elevated housing costs. Other categories like groceries and transportation also slightly exceed the national average, while utilities and healthcare remain close to it.
Learn more
Pflugerville, TX
Pflugerville, TX, presents a cost of living index that is 95% of the nationwide average, indicating a slightly lower overall cost of living. This makes it an attractive option for those seeking a balance between affordability and quality of life.
Learn more
Pinellas Park, FL
Pinellas Park, FL, boasts a cost of living index that is 97% of the nationwide average, reflecting a slightly lower overall cost of living. Notably, the housing and utilities sectors contribute to this favorable comparison, with indices of 95% and 96%, respectively.
Learn more
Plano, TX
Plano, TX, exhibits a cost of living index of 105, which is 5% higher than the nationwide average of 100. This suggests that overall expenses in Plano are slightly above the national standard.
Learn more
Plantation, FL
Plantation, FL, exhibits a cost of living index that is 12% higher than the nationwide average, primarily driven by elevated housing costs. Other categories like groceries and transportation also slightly exceed the national average, while utilities and healthcare remain relatively close to it.
Learn more
Pomona, CA
Pomona, CA, exhibits a cost of living index that is 52% higher than the nationwide average, primarily driven by elevated housing costs. Other categories like groceries and utilities also show slight increases, while healthcare costs remain below the national average.
Learn more
Pompano Beach, FL
Pompano Beach, FL, exhibits a cost of living index that is 10% higher than the nationwide average, primarily driven by elevated housing costs. Other categories like groceries and transportation also surpass the national average, while utilities and healthcare remain slightly below.
Learn more
Puyallup, WA
Puyallup, WA, exhibits a cost of living index that is 10% higher than the nationwide average, primarily driven by elevated housing costs. Other categories like groceries and miscellaneous expenses also surpass the national average, while utilities and transportation remain relatively close to the benchmark.
Learn more
Quincy, MA
Quincy, MA, exhibits a higher cost of living compared to the nationwide average, with an overall index of 125%. This indicates that residents can expect to spend 25% more across various living expenses.
Learn more
Rancho Cordova, CA
The cost of living index in Rancho Cordova, CA, stands at 115%, surpassing the nationwide average by 15%. This indicates that living expenses in Rancho Cordova are generally higher than the national average.
Learn more
Redmond, WA
Redmond, WA, exhibits a cost of living index that is 45% higher than the nationwide average, primarily driven by elevated housing costs. Other categories such as groceries and miscellaneous expenses also surpass the national average, though to a lesser extent.
Learn more
Renton, WA
The cost of living index in Renton, WA, stands at 120, which is 20% higher than the nationwide average of 100. This elevated index reflects higher expenses in various sectors, including housing and healthcare.
Learn more
Richardson, TX
The cost of living index in Richardson, TX, stands at 105, which is 5% higher than the nationwide average of 100. This indicates that overall expenses in Richardson are slightly above the national average.
Learn more
Riverside, CA
Riverside, CA, exhibits a cost of living index that is 23% higher than the nationwide average, primarily driven by elevated housing costs. This makes Riverside a noteworthy location for job seekers considering the overall living expenses.
Learn more
Roseville, CA
Roseville, CA, exhibits a higher cost of living compared to the nationwide average, with a cost of living index of 128. This indicates that living expenses in Roseville are 28% above the national average.
Learn more
Round Rock, TX
The cost of living index in Round Rock, TX, stands at 101, slightly above the nationwide average of 100. Housing, groceries, and healthcare costs are notably higher, while utilities and transportation costs are relatively lower.
Learn more
Sacramento, CA
Sacramento, CA, exhibits a cost of living index that is 10% higher than the nationwide average, primarily driven by elevated housing costs. Despite this, other categories like groceries and utilities remain relatively close to the national average.
Learn more
Sammamish, WA
Sammamish, WA, exhibits a cost of living index that is 72% higher than the nationwide average, primarily driven by a 72% increase in housing costs. Other categories like groceries and utilities also show above-average expenses, making it a significant consideration for job seekers.
Learn more
San Antonio, TX
San Antonio, TX, boasts a cost of living index that is 92% of the nationwide average, making it a more affordable option for many professional job seekers. This index reflects lower housing costs and competitive prices across other essential categories.
Learn more
San Diego, CA
San Diego, CA, exhibits a cost of living index that is 46% higher than the nationwide average, primarily driven by elevated housing costs. Other categories like groceries and transportation also surpass the national average, contributing to the overall higher living expenses.
Learn more
San Jose, CA
San Jose, CA, exhibits a higher cost of living compared to the nationwide average, with an overall index of 139.8. This represents a 39.8% increase over the national average of 100.
Learn more
San Marcos, CA
San Marcos, CA, exhibits a higher cost of living compared to the nationwide average, with an overall index of 118. Housing costs notably stand at 62% above the national average, making it a significant factor in the city's elevated cost of living.
Learn more
San Marcos, TX
San Marcos, TX, boasts a cost of living index that is 94% of the nationwide average, reflecting a generally affordable living environment. This index, derived from housing, groceries, utilities, transportation, healthcare, and miscellaneous expenses, positions San Marcos as a competitive choice for cost-conscious professionals.
Learn more
Sanford, FL
Sanford, FL, boasts a cost of living index that is 95% of the nationwide average, indicating a slightly lower cost of living in this area. This makes Sanford an attractive option for those seeking a more affordable lifestyle without compromising on quality.
Learn more
Santa Clara, CA
Santa Clara, CA, boasts a cost of living index that is 189.9% of the nationwide average, reflecting significantly higher expenses, particularly in housing. This elevated index underscores the importance of considering these costs when planning a move to the area.
Learn more
Santa Clarita, CA
Santa Clarita, CA, exhibits a higher cost of living compared to the nationwide average, with an overall index of 116. This indicates that living expenses in Santa Clarita are 16% above the national average.
Learn more
Schertz, TX
Schertz, TX, boasts a cost of living index that is 96% of the nationwide average, making it a slightly more affordable option for professional job seekers. Notably, housing costs in Schertz are 5% below the national average, offering a potential advantage for those relocating.
Learn more
Seattle, WA
Seattle, WA, exhibits a higher cost of living compared to the nationwide average, with an overall index of 128. This indicates that living expenses in Seattle are approximately 28% greater than the national average.
Learn more
Shoreline, WA
Shoreline, WA, exhibits a cost of living index that is 165% of the nationwide average in housing, reflecting a significant premium. Other categories like groceries and transportation also surpass the average, with indices at 110% and 120%, respectively.
Learn more
Somerville, MA
Somerville, MA, exhibits a cost of living index that is 17.3% higher than the nationwide average, primarily driven by elevated housing costs. Other categories like groceries and utilities remain close to the national average, making Somerville a competitive option for those prioritizing specific living expenses.
Learn more
Spokane Valley, WA
Spokane Valley, WA, presents a cost of living index of 98, which is slightly below the nationwide average of 100. This indicates that living expenses in Spokane Valley are generally 2% lower than the national average.
Learn more
Spokane, WA
Spokane, WA, presents a cost of living index that is 90% of the nationwide average, indicating a relatively affordable living environment for job seekers. This index reflects lower costs in housing and miscellaneous expenses, making it an attractive option for those seeking a balanced lifestyle.
Learn more
Springfield, MA
Springfield, MA, boasts a cost of living index that is 91% of the nationwide average, indicating a relatively affordable living environment for professional job seekers. Notably, housing costs are 22% below the national average, making it an attractive option for those seeking budget-friendly housing.
Learn more
Sugar Land, TX
The cost of living index in Sugar Land, TX, stands at 99, slightly below the nationwide average of 100. This indicates that living expenses in Sugar Land are nearly on par with the national average.
Learn more
Sunnyvale, CA
Sunnyvale, CA, exhibits a significantly higher cost of living compared to the nationwide average, with an overall index of 165. This represents a 65% increase over the national benchmark of 100.
Learn more
Tacoma, WA
Tacoma, WA, exhibits a higher cost of living compared to the nationwide average, with an overall index of 110. This indicates that living expenses in Tacoma are 10% above the national average.
Learn more
Tallahassee, FL
The cost of living index in Tallahassee, FL, stands at 91, which is 1% below the nationwide average of 100. This slight decrease suggests that living expenses in Tallahassee are marginally more affordable than the average American city.
Learn more
Tampa, FL
Tampa, FL, boasts a cost of living index that is 96% of the nationwide average, making it a relatively affordable place to live. Housing, groceries, and miscellaneous costs are slightly below the national average, while transportation costs are slightly above.
Learn more
The Colony, TX
The Colony, TX, boasts a cost of living index of 95, which is 5% lower than the nationwide average of 100. This makes it an attractive option for those seeking a more affordable living environment.
Learn more
The Woodlands, TX
The Woodlands, TX, exhibits a cost of living index that is 10% higher than the nationwide average, primarily driven by housing costs. Other categories like groceries and transportation remain slightly below the national average.
Learn more
Tukwila, WA
Tukwila, WA, exhibits a cost of living index that is 34% higher than the nationwide average in housing, while other categories like groceries and healthcare remain relatively close to the national average, making it a balanced consideration for job seekers.
Learn more
Vancouver, WA
Vancouver, WA's cost of living index stands at 98, slightly below the nationwide average of 100. This indicates that living expenses in Vancouver are generally 2% less than the national average.
Learn more
Vista, CA
The cost of living index in Vista, CA, stands at 124, which is 24% higher than the nationwide average of 100. This elevated index reflects higher expenses, particularly in housing, which is 79% above the national average.
Learn more
Westfield, MA
Westfield, MA, presents a cost of living index that is 98% of the nationwide average, indicating a slightly lower overall cost of living. Housing and miscellaneous expenses are notably lower, while utilities and healthcare costs are marginally higher.
Learn more
Weston, FL
Weston, FL, exhibits a cost of living index that is 15% higher than the nationwide average, primarily driven by elevated housing costs. Other categories like groceries and transportation also show modest increases, while utilities and healthcare remain close to the national average.
Learn more
Worcester, MA
Worcester, MA, presents a cost of living index that is 99% of the nationwide average, indicating a slightly lower cost of living in most areas. Notably, housing and utilities are below the national average, while groceries and transportation exceed it.
Learn more

There are 1,850 job openings in Torrance, CA, today!

Take a deeper dive into the job market in Torrance, CA

Discover what it's like to work in Torrance, CA. Learn if you need a car, explore popular employers, the job market, and the best neighborhoods to live in.

City
Overview
Torrance, CA
1,850 job openings