City
Salary

What is the average salary in Capitola, CA?

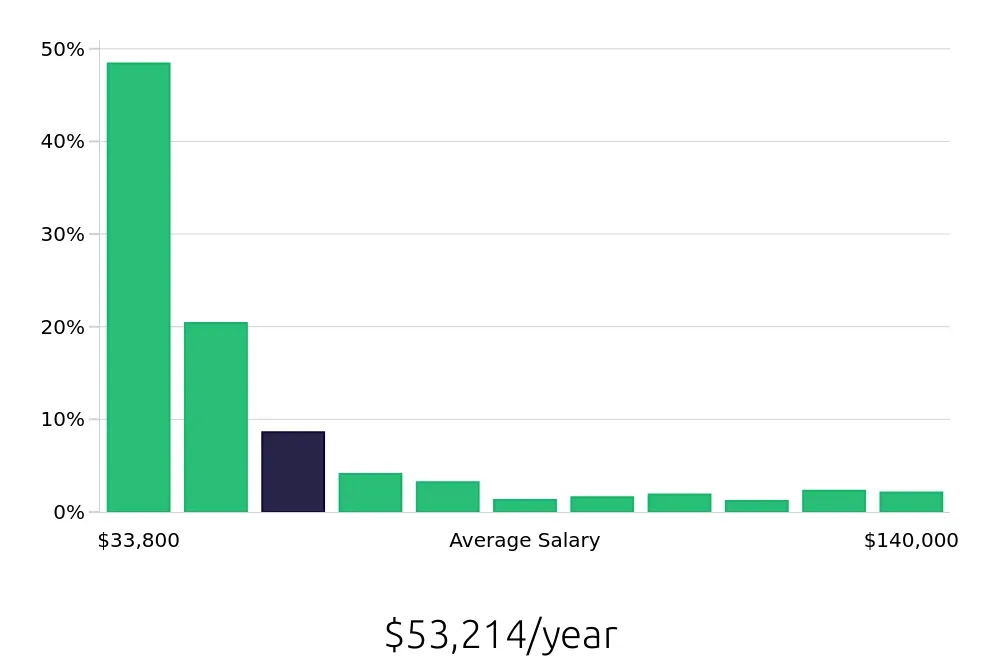
The average salary in Capitola, CA is $53,588 per year.

Job seekers in Capitola, CA, can expect competitive salaries across various industries. The average yearly salary stands at $53,588. This figure reflects the diverse job market and the potential for rewarding careers in the area.


Here are some salary ranges for different sectors:

  • Entry-level roles start around $33,500.
  • Professional positions average about $107,636.
  • The highest salaries can exceed $150,000.
These figures show ample opportunity for career growth and higher earnings based on experience and job role.

View jobs in Capitola, CA

What are the best paying jobs in Capitola, CA?

Job seekers in Capitola, CA, have many opportunities to find well-paying roles. Some of the top-paying jobs include Retail Sales Associates, Team Members, and Sales Associates. Retail Sales Associates earn an average salary of $48,100 per year, which is higher than the average for Team Members at $42,397 and Sales Associates at $36,173. Those interested in retail positions can expect competitive salaries. This sector offers roles with good benefits and the chance to work in a bustling environment. Good customer service skills and the ability to work well with others are often key to success in these jobs. By choosing a role in this area, job seekers can look forward to both financial rewards and the chance to develop valuable skills.
Graph displaying best paying job salaries in Capitola, CA, highlighting Retail Sales Associate with the highest at $48,100 and Sales Associate with the lowest at $36,173.
  1. Retail Sales Associate
    Average Salary: $48,100
    This role involves greeting customers and helping them find the right products. It often requires working for retailers like local boutiques. Great for someone who enjoys interacting with people and enjoys a fast-paced environment.
    Find Retail Sales Associate jobs in Capitola, CA


  2. Team Member
    Average Salary: $42,397
    This position typically involves working in fast food or quick-service restaurants. It includes taking orders, preparing food, and ensuring a clean environment. Great for someone who likes a dynamic work environment and can work well in a team.
    Find Team Member jobs in Capitola, CA


  3. Sales Associate
    Average Salary: $36,173
    This job involves selling products to customers in a retail setting. Associates work in stores selling a variety of items. It requires excellent customer service skills and the ability to handle cash transactions. Great for those who enjoy helping people and work in a retail environment.
    Find Sales Associate jobs in Capitola, CA

What are the best paying jobs in Capitola, CA without a degree?

Capitola, CA, offers several high-paying job opportunities that do not require a college degree. Line cooks earn an average of $41,043 annually, followed closely by baristas with $39,870 per year. Dishwashers and servers also bring in respectable incomes, at $38,121 and $32,458, respectively. These positions provide a good starting point for those looking to enter the workforce with competitive pay.
Graph displaying best paying job salaries in Capitola, CA without a degree, highlighting Line Cook with the highest at $41,043 and Server with the lowest at $32,458.
  1. Line Cook
    Average Salary: $41,043
    This role prepares and cooks meals in a restaurant kitchen. It involves working quickly in a fast-paced environment. Work in local eateries and restaurants.
    Find Line Cook jobs in Capitola, CA


  2. Barista
    Average Salary: $39,870
    Create and serve coffee and other beverages. Duties include operating espresso machines. Work in coffee shops in the area.
    Find Barista jobs in Capitola, CA


  3. Dishwasher
    Average Salary: $38,121
    Clean dishes, utensils, and kitchen equipment. This position demands attention to detail. Find opportunities in area restaurants and cafes.
    Find Dishwasher jobs in Capitola, CA


  4. Server
    Average Salary: $32,458
    Provide table service to guests. Duties include taking orders and serving food and drinks. Work at local dining establishments.
    Find Server jobs in Capitola, CA

Which companies offer the top salaries in Capitola, CA?

Looking for top-paying jobs in Capitola? Whole Foods Market stands out with an average salary of $47,467. This supermarket offers competitive pay compared to other companies in the area. Macy's follows closely with an average salary of $45,345, making it another solid choice for job seekers. Other notable companies include New Leaf Community Markets and Right At Home. Both companies offer respectable salaries, with New Leaf paying an average of $43,016 and Right At Home at $40,000. These figures highlight the varying salary levels available in Capitola, providing options for different career goals and preferences.
Graph displaying company salaries in Capitola, CA, highlighting Whole Foods Market with the highest at $47,467 and Right At Home with the lowest at $40,000.
  1. Whole Foods Market
    Average Salary: $47,467
    Whole Foods Market offers a range of positions from grocery clerks to management roles. Employees enjoy competitive pay and benefits.


  2. Macy's
    Average Salary: $45,345
    Macy's provides retail jobs with opportunities for advancement. It offers a welcoming environment and good employee benefits.


  3. New Leaf Community Markets
    Average Salary: $43,016
    New Leaf Community Markets focuses on local and organic products. They offer fair pay and a supportive work culture.


  4. Right At Home
    Average Salary: $40,000
    Right At Home provides in-home care services. Employees get good compensation and flexible working hours.

How does the cost of living in Capitola, CA compare to the national average?

The cost of living in Capitola, California, exceeds the nationwide average in several key areas. Housing prices are 160% higher, with an index of 260. This means that renting or buying a home in Capitola is significantly more expensive than the national norm. Additionally, the groceries index stands at 120%, reflecting a 20% increase over the average cost. These elevated costs highlight the financial considerations job seekers should weigh when contemplating a move to Capitola.
Cost of living comparison graph for Capitola, CA vs. Nationwide: housing 160% higher, groceries 20% higher, utilities 10% higher, transportation 12% higher, healthcare 5% higher, miscellaneous 25% higher.

The cost of living in Capitola, CA, presents some notable differences when compared to the nationwide average. The housing index stands at 260, indicating that housing costs are significantly higher than the national average of 100. Specifically, this means housing costs in Capitola are 160% greater than the nationwide average. Individuals moving to Capitola should expect to allocate a substantial portion of their budget to secure housing.


Other expenses in Capitola also reflect higher costs. Groceries, for instance, have a cost of living index of 120. This signifies a 20% increase over the average. Utilities cost slightly above the national average at 110, a 10% increase. Transportation costs mirror the national average, with a slight uptick at 112, which is 12% higher. Healthcare expenses are relatively close to the national average with an index of 105, which is just 5% higher. Miscellaneous expenses, which include items like clothing and entertainment, are at 125, marking a 25% increase over the average. These statistics highlight the overall trend of higher living costs in Capitola compared to the rest of the country.

There are 60 job openings in Capitola, CA, today!

Take a deeper dive into the job market in Capitola, CA

Discover what it's like to work in Capitola, CA. Learn if you need a car, explore popular employers, the job market, and the best neighborhoods to live in.
City
Overview
Capitola, CA
60 Job Openings